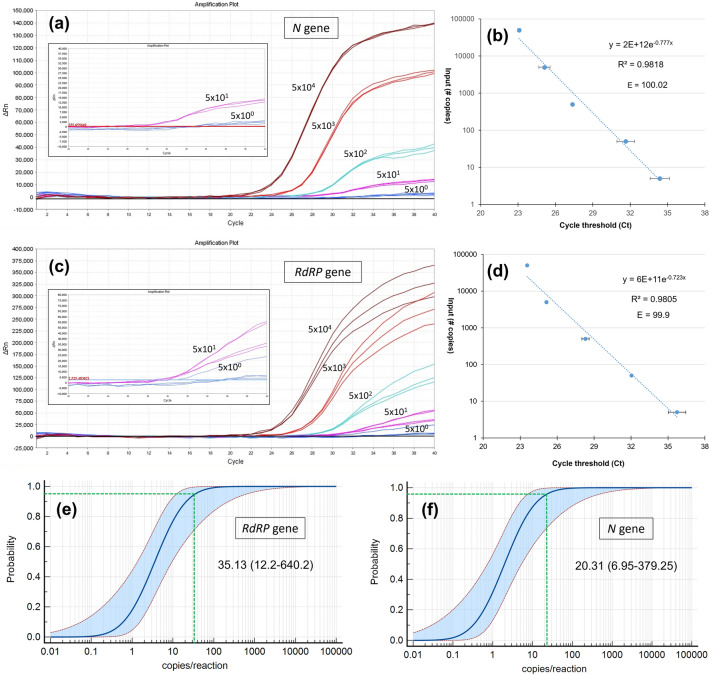
Figure 4.
Determination of the limit of detection (LOD) for RdRP and N primers. The 5 × 10⁴ copy/µl pseudoviral RNA was serially diluted. The amplification plots (a,c) and the amplification efficiencies (E) (b,d) for N and RdRP genes were represented, respectively. The R2 value of the trendline and the efficiency (E) of the standard curve were displayed on each graph. The error bars represent the standard deviation between the replicates. The probit regression analysis of the LODs based on 10 technical replicates of serially diluted synthetic RNA: (e) RdRP and (f) N genes. Green dotted lines indicate LOD and values are denoted with 95% confidence intervals (CI) in parenthesis.

