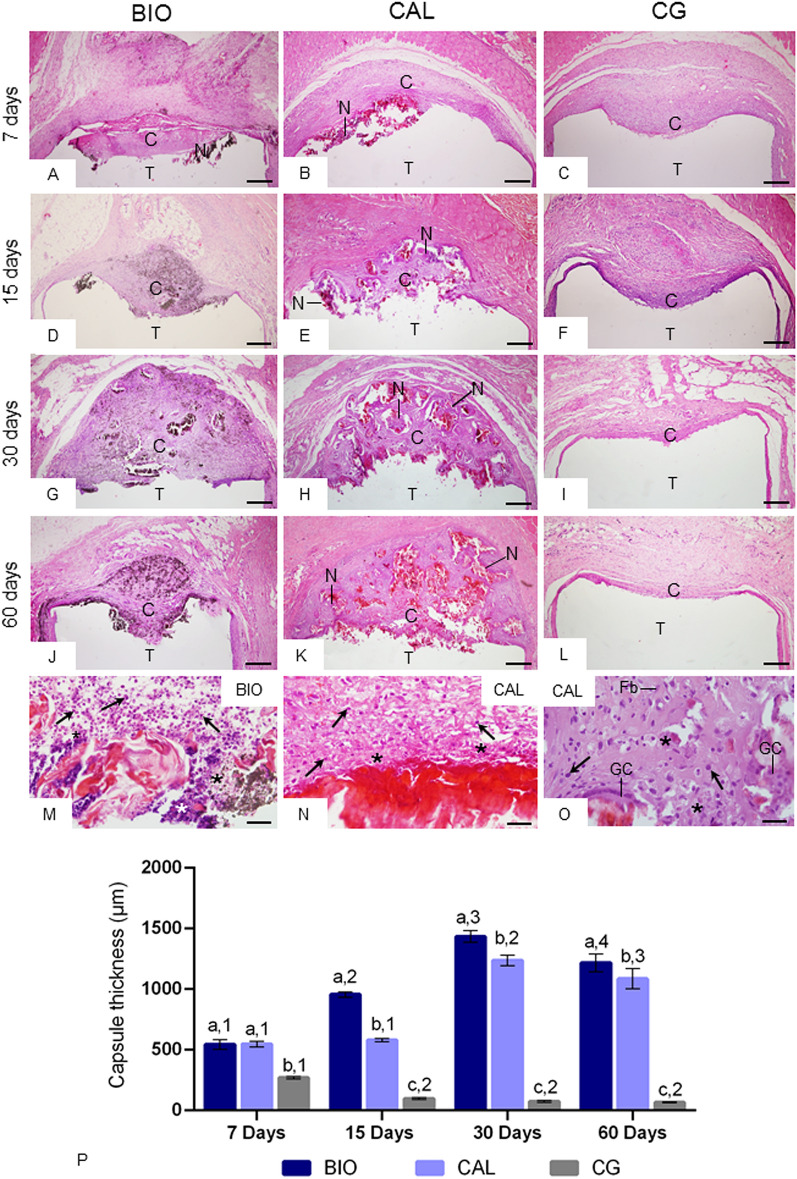
Figure 2.
(A–L) Light micrographs of sections showing an overview of capsules adjacent to the opening of the implanted tubes (T). In all periods, well-defined capsules (C) are seen. In BIO specimens, several particles (brown/black color) are dispersed throughout the capsules (C). In all periods, thin capsules are observed in the CG. Note necrosis areas (N) in the capsules around Bio-C Temp (A) and Calen paste (B,E,H,K). Bars: 152 µm. (M–O) High magnification of portions of capsules in close juxtaposition to the Bio-C Temp at 7 days (M) and Calen paste at 7 (N) and 60 (O) days; necrosis areas (asterisks) are observed. Arrows, inflammatory cells; Fb, fibroblast; GC, multinucleated giant cell. Bars: 27 µm. HE. (P) The graphic shows the values (expressed as mean ± standard deviation) of capsule thickness (in µm). In each period, the comparison among the groups is indicated by superscript letters; different letters = significant difference. The superscript numbers indicate the analysis of each group over time; different numbers = significant difference. Tukey’s test (p ≤ 0.05).

