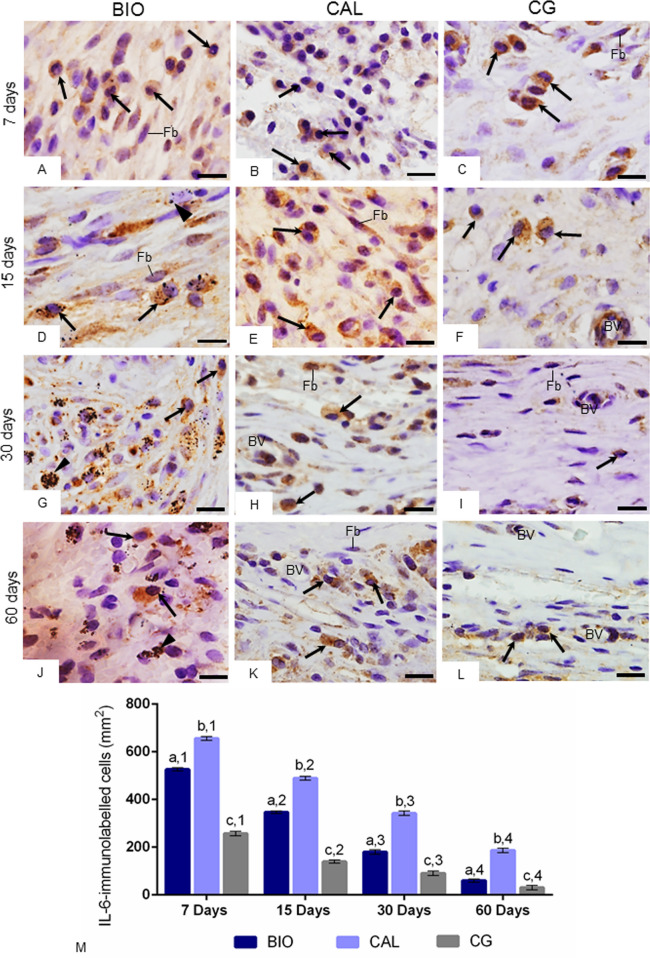
Figure 4.
(A–L) Light micrographs showing portions of capsule of sections submitted to immunohistochemistry reaction for detection of IL-6 (brown/yellow color) and counterstained with hematoxylin. In all periods, inflammatory cells with strong immunolabelling in their cytoplasm (arrows) are present in the capsules of all groups. Immunolabelled fibroblasts (Fb) are also observed. BV, blood vessels; material particles (arrowheads). Bars: 18 µm. (M) The graphic shows the values (expressed as mean ± standard deviation) of the numerical density of IL-6-immunolabelled cells in the capsules. In each period, the comparison among the groups is indicated by superscript letters; different letters = significant difference. The superscript numbers indicate the analysis of each group over time; different numbers = significant difference. Tukey’s test (p ≤ 0.05).

