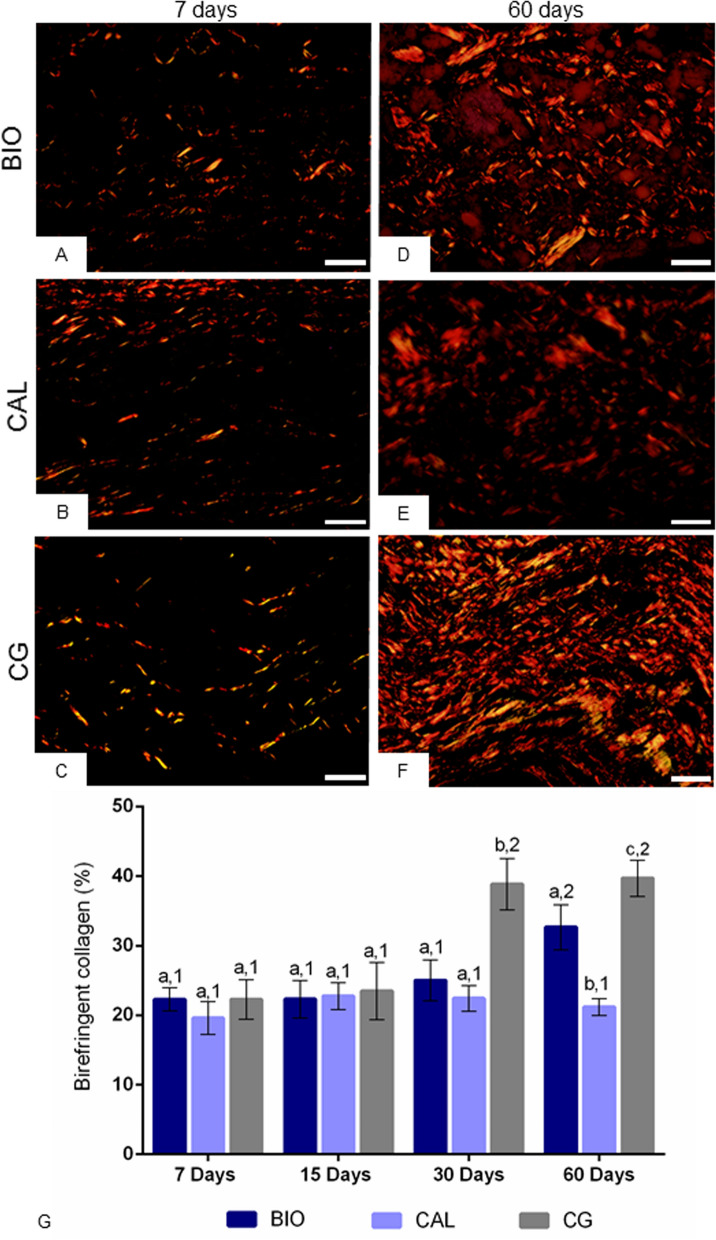
Figure 6.
(A–F) Light micrographs showing portions of capsule from sections subjected to picrosirius-red and analyzed under polarized illumination. At 7 days, thin birefringent collagen fibers (in red-orange) are dispersed in the capsules. At 60 days, the capsules exhibit thick bundles of birefringent collagen; note an accentuated birefringence in capsules of BIO (D) and CG (F) groups compared to the CAL group (E). Bars: 18 µm. (G) The graphic shows the values (expressed as mean ± standard deviation) of the amount of birefringent collagen (in percentage) in the capsules. In each period, the comparison among the groups is indicated by superscript letters; different letters = significant difference. The superscript numbers indicate the analysis of each group over time; different numbers = significant difference. Tukey’s test (p ≤ 0.05).

