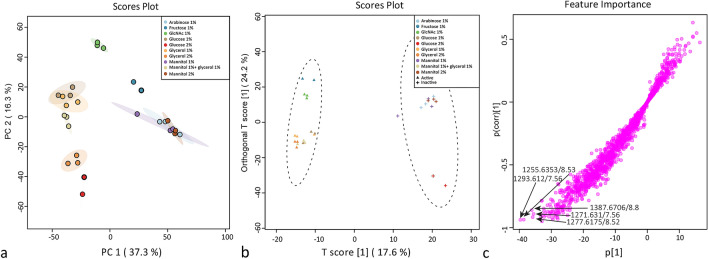
Figure 1.
Differential production of metabolites depending on the carbon source. (a) PCA score plot of Streptomyces sp. MBT27 metabolites produced in cultures with different carbon sources, namely, 1% arabinose, 1% fructose, 1% GlcNAc, 1% glucose, 2% glucose, 1% glycerol, 2% glycerol, 1% mannitol, 1% mannitol + 1% glycerol and 2% mannitol (%ages in w/v). (b) OPLS-DA score plot. Triangles and crosses represent samples of active and inactive groups respectively, circular areas represent the 95% confidence region of each group. (c) OPLS-DA loadings S-plot. Arrows indicate the most discriminative features that positively correlate with the active groups.

