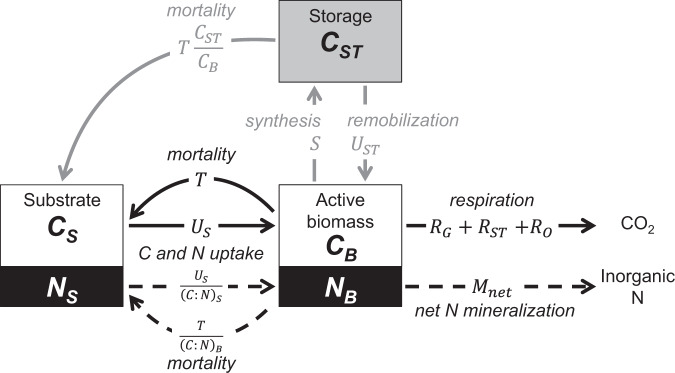
Fig. 2. Schematic of a dynamic microbial model that includes intracellular C storage.
C and N compartments are shown as white and black boxes, and C storage in gray (subscripts “S”, “B”, and “ST” refer to substrate, active microbial biomass, and storage); solid and dashed arrows indicate C and N rates, respectively (US substrate C uptake, S and UST, storage C synthesis and remobilization, RG, RST, and RO, respiration associated with growth on substrate, growth on storage, and overflow processes, Mnet net N mineralization, T microbial mortality).

