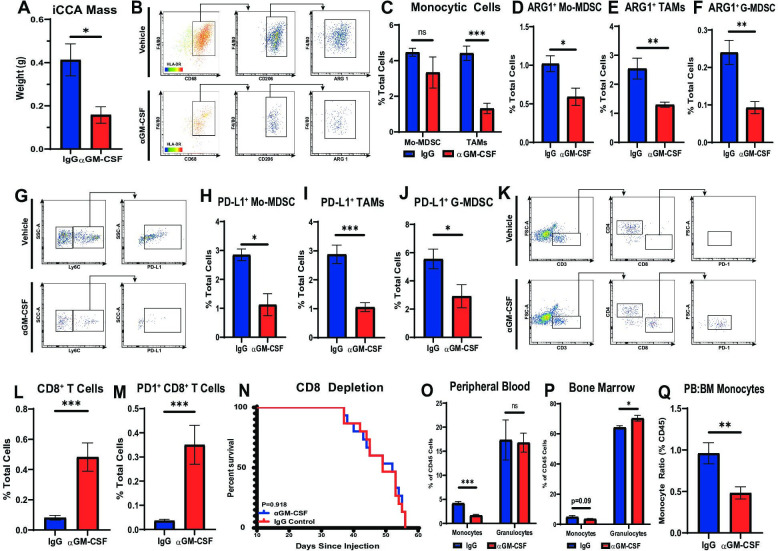
Figure 5.
Neutralisation of GM-CSF decreases tumour-infiltrating monocytic lineages and enhances antitumour T cell immunity. (A) Graph compares resected tumour weights after orthotopically implanted URCCA4.3 tumours were established and treated with isotype control (n=5) or anti-GM-CSF (n=5) antibodies for 17 days. (B) Representative flow cytometry plots demonstrate gating strategy for identifying alternatively activated TAM in orthotopic URCCA4.3 tumours after treatment for 14 days as indicated. (C) Flow cytometry analysis compares the prevalence of Mo-MDSCs and TAMs after established orthotopic URCCA4.3 tumours were treated with IgG control (n=7) or anti-GM-CSF (n=8) for 28 days. (D, E and F) Graphs compare the prevalence of ARG1+ Mo-MDSCs (D), ARG1+ TAMs (E) and ARG1+ G-MDSCs (F) after treatment for 28 days as indicated. (G) Representative flow cytometry plots demonstrate gating strategies for identifying PD-L1+ Mo-MDSC after mice with established orthotopic URCCA4.3 tumours were treated for 28 days as indicated. (H, I and J) Graphs compare the prevalence of PD-L1+ Mo-MDSC (H), PD-L1+ TAMs (I) and PD-L1+ G-MDSC (J) by flow cytometry analysis after established URCCA4.3 tumours were treated with IgG control (n=7) or anti-GM-CSF (n=8) for 28 days. (K) Representative flow cytometry plots demonstrate gating strategy for identifying tumour-infiltrating T cell subsets after mice with established orthotopic URCCA4.3 tumours were treated for 28 days as indicated. (L) Graph compares the prevalence of tumour-infiltrating cytotoxic CD8+ T cells after established URCCA4.3 tumours were treated with IgG control (n=7) or anti-GM-CSF (n=8) for 28 days. (M) Graph shows the prevalence of tumour-infiltrating PD1+ CD8 T cells by flow cytometry analysis after mice bearing orthotopic URCCA4.3 tumours were treated with IgG control (n=7) or anti-GM-CSF (n=8) for 28 days. (N) Kaplan-Meier curve compares overall survival of CD8 depleted URCCA4.3 tumour-bearing mice treated with IgG (n=15) or anti-GM-CSF (n=14). P value determined by log-rank test. (O and P) Graphs compare the prevalence of peripheral blood (O) and bone marrow (P) monocytes and granulocytes by flow cytometry analysis in mice bearing orthotopic URCCA4.3 tumours after 14 days of treatment with IgG control (n=8) or anti-GM-CSF (n=8). (Q) Graph shows the ratio of peripheral blood to bone marrow monocytes in mice bearing orthotopic URCCA4.3 tumours after 14 days of treatment with IgG control (n=8) or anti-GM-CSF (n=8). All graph bars depict means ± SEM, and p values were determined by Mann-Whitney U test. *p<0.05, **p<0.01 and ***p<0.001. ARG1, arginase 1; BM, bone marrow; G-MDSC, granulocytic myeloid-derived suppressor cells; GM-CSF, granulocyte–macrophage colony-stimulating factor; Mo-MDSC, monocytic myeloid-derived suppressor cells; ns, not significant; PB, peripheral blood; PD1, programmed cell death protein 1; PD-L1, programmed death ligand 1; TAMs, tumour-associated macrophages.

