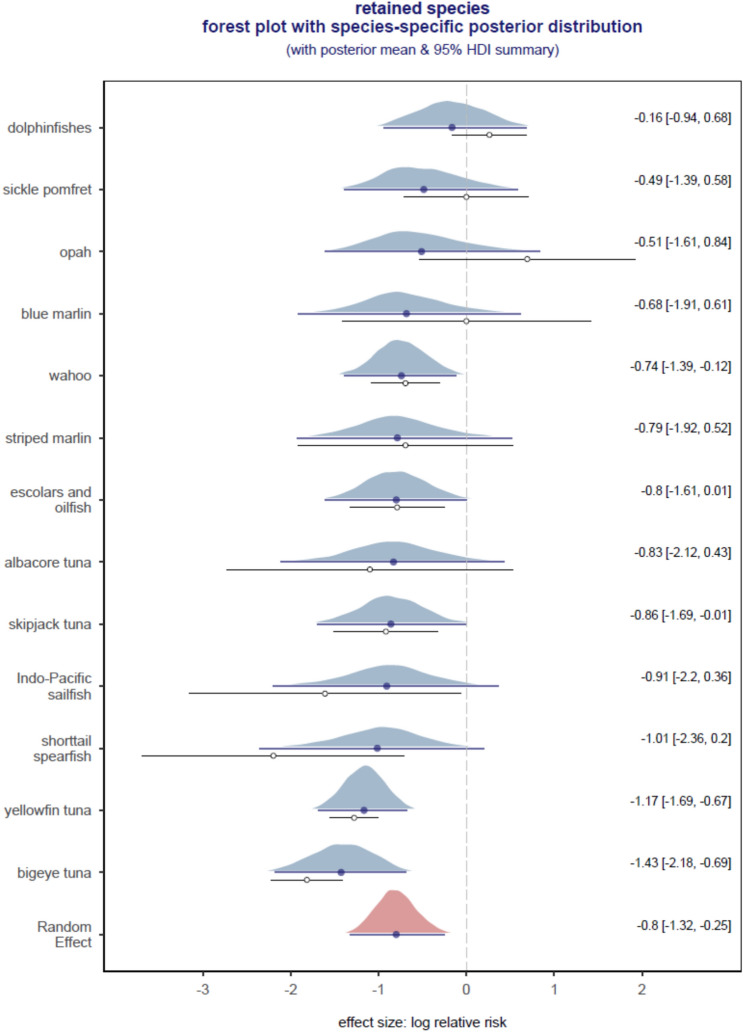
Figure 3.
Model-predicted log relative risk ratio derived for 13 species-specific effect sizes for retained species. Shrinkage estimates were derived using a precision weighted Bayesian random-effects meta-analytic model with Gaussian likelihood. Polygon = density of the posterior draws (the effective sample size = 10,000) and the horizontal line underneath each polygon = 95% highest posterior density interval (HDI) of the posterior draws, solid dot = mean of the posterior draws shrunk towards the pooled or Random Effect, which is the mean or overall expected log relative risk ratio for all 13 species (right-side labels = the posterior mean and HDI summaries). Below the density polygon is an open dot = observed effect size and thin horizontal line = observed effect size ± 1 standard deviation derived using the metafor::escalc() function. The difference between solid and open dots reflects the degree of shrinkage that is dependent on sample size.

