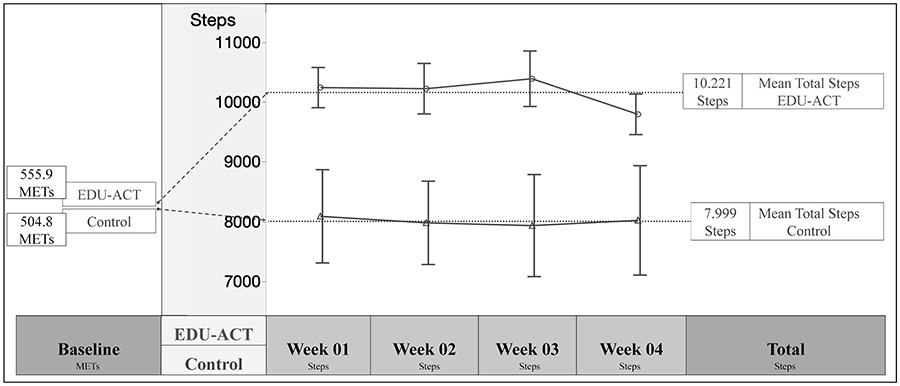
Figure 4 —

Physical activity over the 4 weeks. This figure shows the PA behavior observed at baseline and over the course of 4 weeks after the EDUACT intervention and control condition. At baseline, both groups were in the same low PA level. The intervention group showed an increase in PA participation and maintained consistency throughout the 4 weeks. METs = metabolic equivalent per week measured by the IPAQ showing sedentary behavior at baseline; EDU-ACT= Education for Action program.
