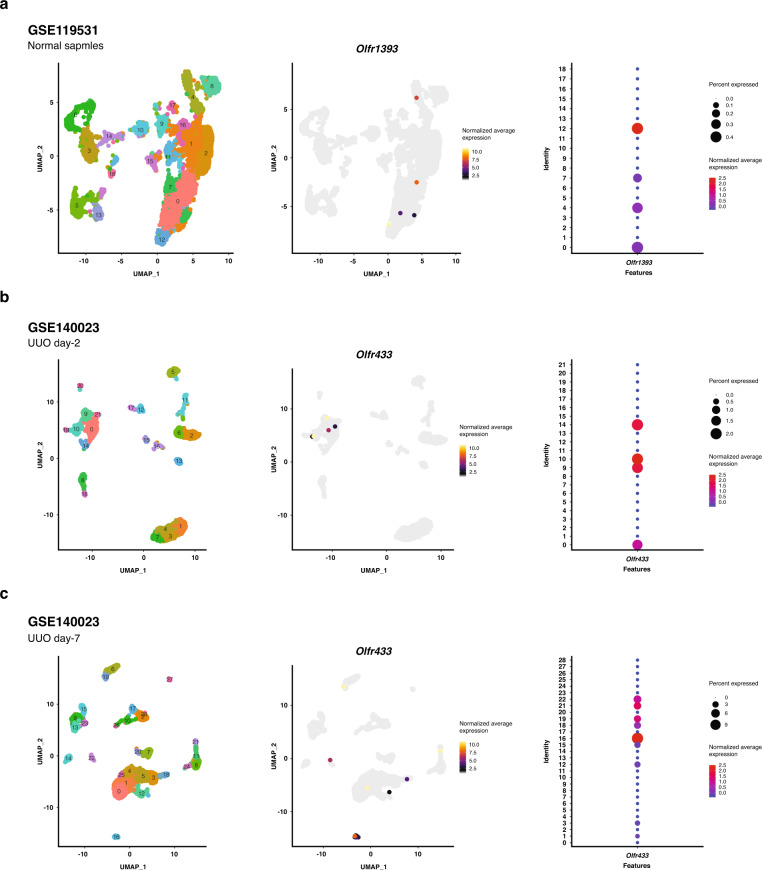
Fig. 4. Localization of Olfr1393 and Olfr433 by analysis of two single-cell RNA-sequencing (scRNA-seq) datasets related to normal and UUO kidneys.
Expression of Olfr1393 in normal kidney (GSE119531) (a). Expression of Olfr433 in UUO samples at day-2 (b) and 7 (c) postinjury (GSE140023). The left uniform manifold approximation and projection (UMAP) plots represent unsupervised clustering of the scRNA-seq datasets. The middle UMAP plots show the normalized average expression of ORs genes (yellow and grey color show high and low expression of genes). The dot plots indicate expression of Olfr1393 and Olfr433 across identified clusters (the circle size denotes percent of cells expressing OR genes and red and blue colors indicate high and low expression of OR genes, respectively).

