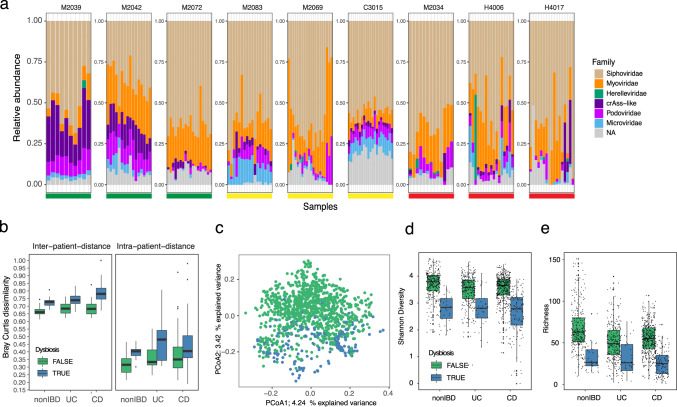
Fig. 4. The metagenomics estimated virome is personal and highly stable in healthy controls.
a Longitudinal virome compositions for three nonIBD (green bar), three UC (yellow bar) and three CD (red bar) diagnosed subjects. Each panel represents a subject where the virome composition was organised according to the total relative abundance according to the taxonomic viral family, where ‘NA’ populations are coloured grey. b Dissimilarity boxplots based on Bray–Curtis distance (BC) function between samples from different subjects (first panel inter-patient-distance) and between samples from the same subject (second panel intra-patient-distance). The BC distances are shown for samples from nonIBD (n = 326), UC (n = 323) and CD (n = 573) diagnosed subjects. Furthermore, BC distances are coloured according to dysbiosis (blue, UC = 39 samples, CD = 133 samples, nonIBD = 38 samples) or not (green, UC = 284 samples, CD = 425 samples, nonIBD = 286 samples). c Principal component analysis (PCoA) of Bray–Curtis distance matrix calculated from the viral abundance matrix in HMP2. Each point is coloured according to diagnosed dysbiosis as in (b). d Shannon-diversity estimates of metagenomics derived viral populations and coloured according to dysbiosis as in (b). e Per sample viral population richness based on the number of viral populations detected (abundance >0) in the samples. Coloured according to dysbiosis as in (b). nonIBD: healthy control, UC ulcerative colitis, CD Crohn’s disease.

