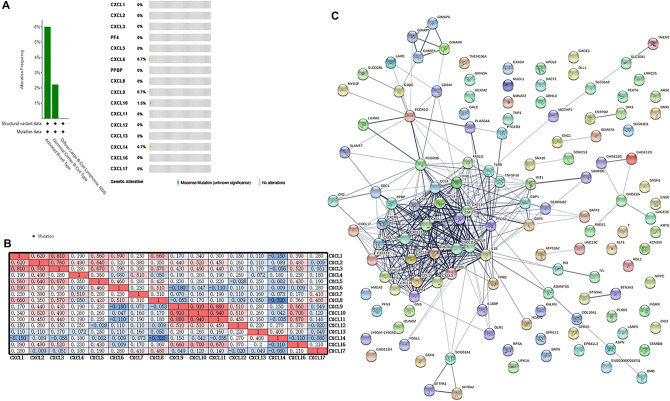
Figure 5.
CXCL gene expression and mutation analysis in DLBCL. (A) CXCL gene expression and mutation analysis in DLBCL (cBioPortal, cBioPortal, https://www.cbioportal.org/). (B) Correlation between different CXCLs in DLBCL (EXCEL, version Microsoft Office Mondo 2016, https://office.microsoft.com/excel) (note: red indicates that the two parameters were positively correlated, and blue indicates that the two parameters were negatively correlated. The darker the color, the stronger the correlation). (C) Network for CXCLs and frequently altered neighboring genes (STRING, https://string-db.org/, version 11.5).

