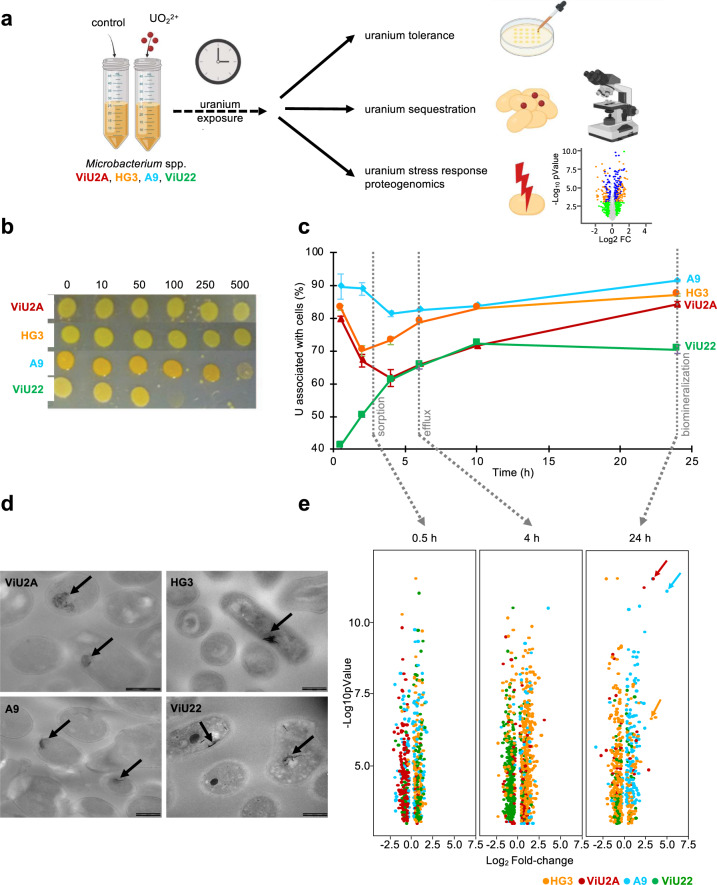
Fig. 1. Interactions of Microbacterium strains ViU2A, HG3, A9 and ViU22 with uranium.
a Schematic workflow to monitor uranium tolerance, sequestration and stress response of strains ViU2A, HG3, A9 and ViU22. b Uranium tolerance assay: cells of strains ViU2A, HG3, A9 and ViU22 were exposed to 0–500 µM uranium for 24 h and drops of cell suspension were spotted onto LB agar plates. Cell growth was observed after 2 days at 25 °C. c Time evolution of the uranium (% of the initial concentration) associated with the cells of strains ViU2A (red), HG3 (orange), A9 (blue) and ViU22 (green). The sampling times for proteomics analysis are indicated by the dotted lines. Error bars denote the standard deviations of triplicate measurements. When not visible, error bars are smaller than the symbols. d TEM micrograph of cells exposed to 10 µM U(VI) for 24 h at 25 °C. The needle-like structures indicated by the arrows were previously shown to contain U, Ca, K and P in strain A9 [44]. Scale bars correspond to 300 nm for ViU2A and HG3 and to 200 nm for A9 and ViU22. e Volcano plot showing proteomic data at 0.5, 4 and 24 h of uranium exposure for ViU2A (red dots), HG3 (orange dots), A9 (blue dots) and ViU22 (green dots). The position of UipA protein plots at 24 h is indicated by arrows.

