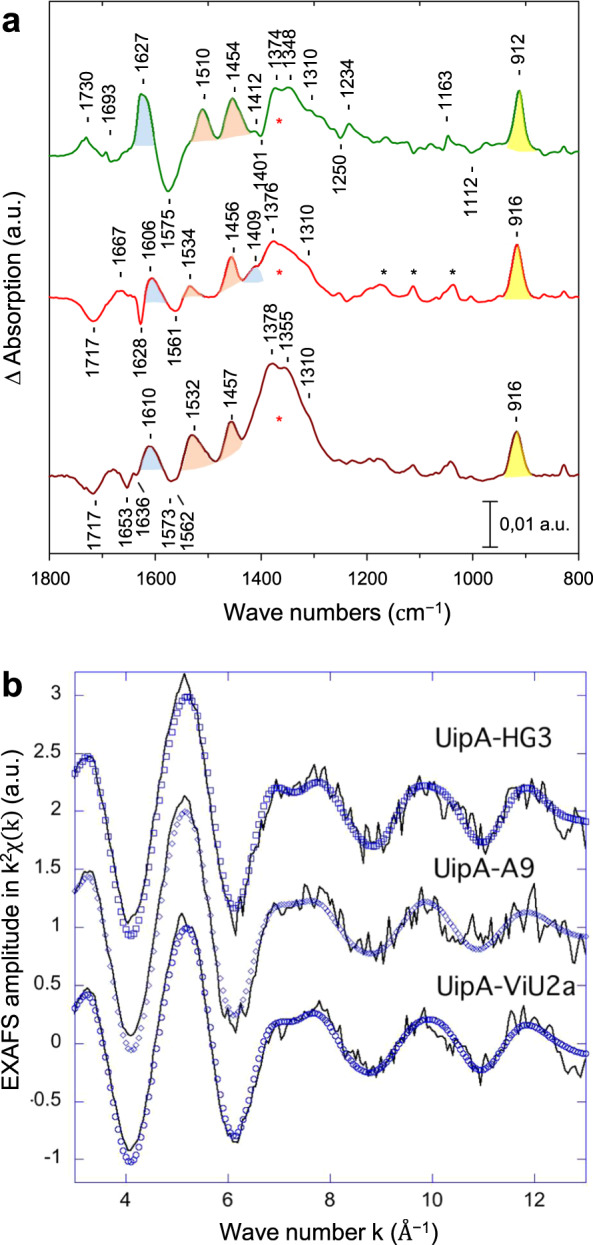
Fig. 2. Characterization of uranyl coordination by FTIR and EXAFS spectroscopy.

a FTIR difference spectra recorded with UipAext with UO22+ – minus – without UO22+. Green line: UipAext-A9; red line: UipAext-HG3; brown line: UipAext-ViU2A. Black * correspond to IR bands of the MES buffer and red * to a large band that is essentially due to the ν3as(NO3−) IR mode. The bands assigned to the modes of monodentate carboxylates are colored blue, and those assigned to bidentate carboxylates are colored orange. The band assigned to the νas(UO2) mode is colored yellow. b EXAFS spectra at the U LIII edge of UipAext-HG3, UipAext-A9 and UipAext-ViU2a. Experimental spectra = straight line, fit = blue forms.
