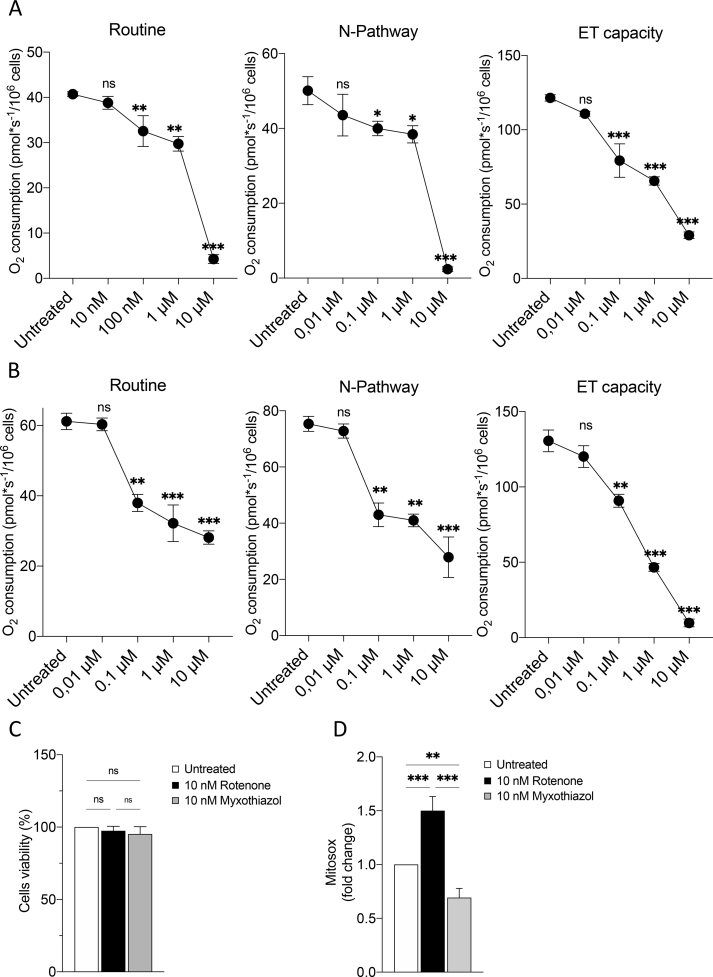
Fig. S4.
Characterization of HAP1 parental cell line treated with rotenone and myxothiazol. A. Quantitative analysis of the oxygen consumption in the analyzed states of HAP1 parental cells before and after the exposure to different concentration of rotenone. Data are expressed as means ± SD (n = 3) and compared to untreated cells. B. Quantitative analysis of the oxygen consumption in the analyzed states of HAP1 parental cells before and after the exposure to different concentration of myxothiazol. Data are expressed as means ± SD (n = 3) and compared to untreated cells. C. Cell viability of HAP1 cell lines treated with 10 nM rotenone or 10 nM myxothiazol. Data are indicated as the mean ± SE (n = 3) and compared to untreated cells. D. Measurement of mitochondrial superoxide production via staining with MitoSOX Red after treatments with 10 nM rotenone or 10 nM myxothiazol. Data were expressed as mean ± SD (n = 3) and compared to untreated cells. Data were analyzed by one-way ANOVA, with *p < 0.05, **p < 0.01 and ***p < 0.001.

