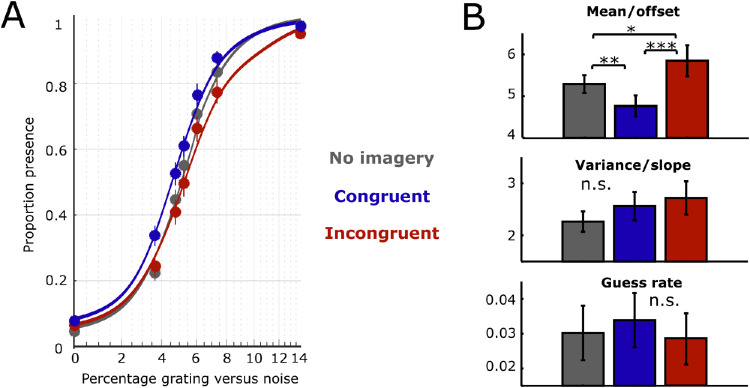
Figure 2.
Results. (A) Psychometric function per condition. Solid points represent proportion presence trials at the different visibility levels for each condition averaged over participants. Vertical lines reflect SEM for these points. (B) Curve parameter estimates. Top: mean, the signal value that is associated with a 0.5 probability of reporting stimulus presence. Middle: variance/slope, the sensitivity of presence responses to changes in signal. Bottom: guess rate, the proportion of presence responses for zero signal. *p < 0.05; **p < 0.01; ***p < 0.001.

