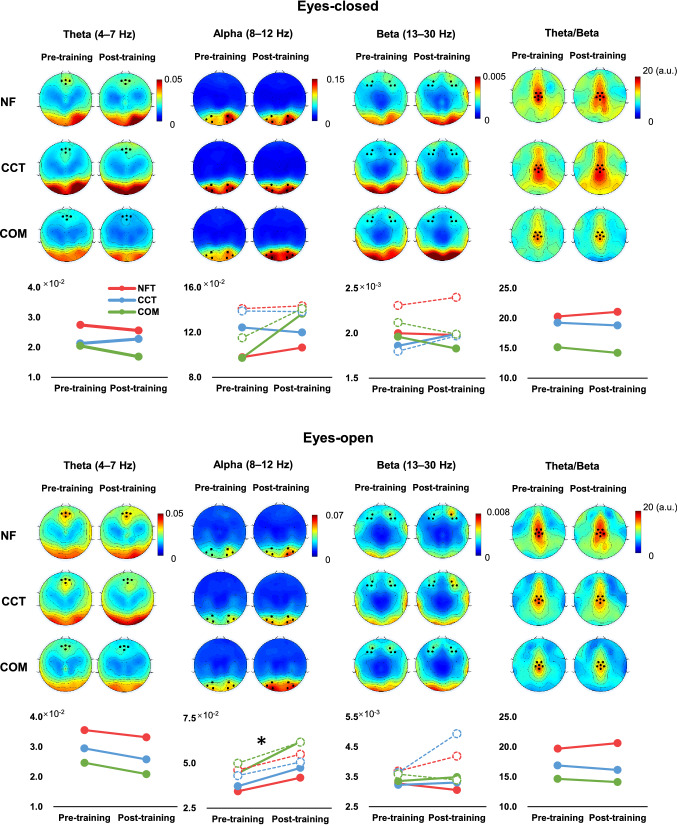
Fig. 3.
Pre- and post-training EEG topographic map and line charts. Topographic maps of relative EEG power, with selected electrodes marked by black dots. The line chart below illustrates the changes pre- and post-training, with solid lines representing the left electrodes and the dotted lines representing the right electrodes for alpha and beta. *p < 0.05

