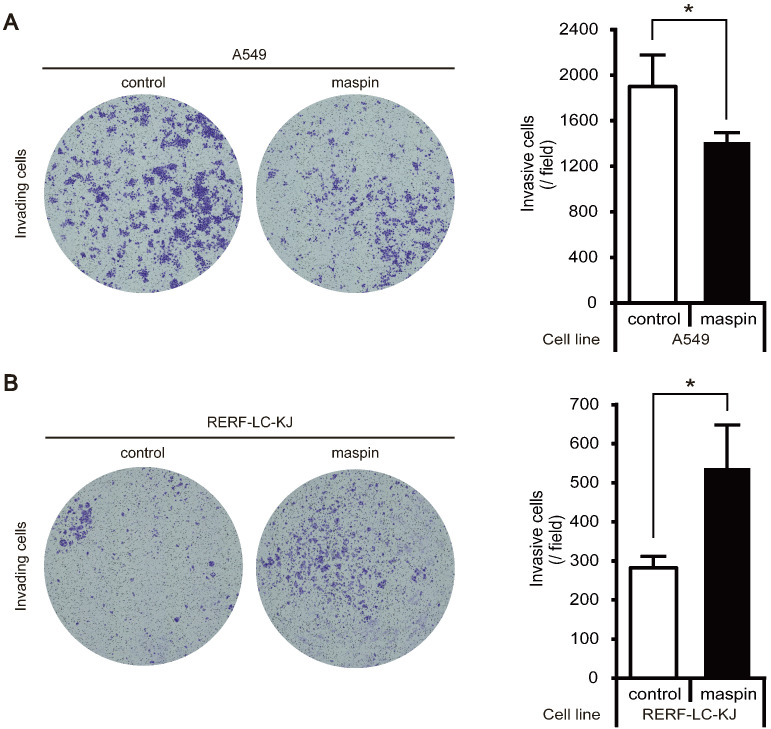
Fig. 3.
Cell invasion capability of maspin stable cell lines. (A) Cell invasion assay in A549 stable cell lines. Representative examples of invading cells stained with crystal violet and total cell count passed through the basement membrane matrix. The invasion of A549 stable cell lines was assessed after 24 h. Data are shown as mean ± SD (n = 3). *P < 0.05; Student’s t-test. (B) Cell invasion assay of RERF-LC-KJ stable cell lines. Representative examples of invading cells stained with crystal violet and total cell count passed through the basement membrane matrix. Invasion of RERF-LC-KJ stable cell lines was assessed after 72 h. Data are shown as mean ± SD (n = 3). *P < 0.05; Student’s t-test

