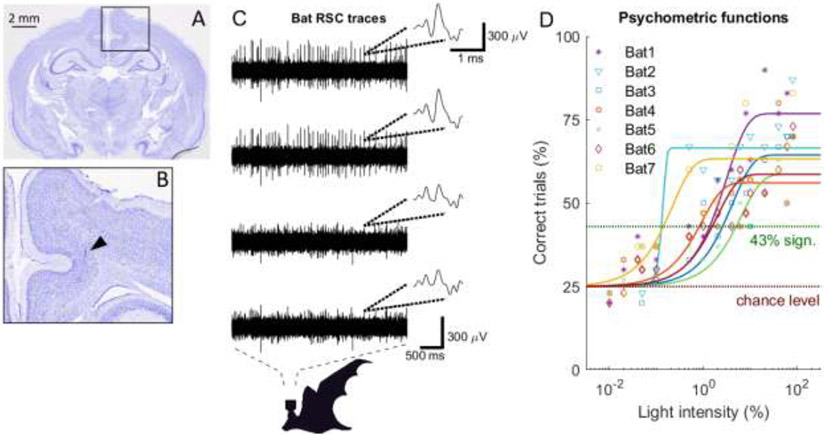
Fig 2: RSC histology verification, RSC neural traces and psychometric functions.
(A) Nissl stained coronal section of the bat’s brain. (B) Zoom-in on the RSC region where a tetrode track is marked by the black triangle. (C) Example neural traces from the four channels of an example tetrode positioned in the bat RSC. Insets show example waveforms as represented on the four tetrode channels. Time and amplitude scale bars are indicated. (D) Psychometric measurements as a function of light intensity (represented in percentages of the LED being on or off, see Material and Methods) for seven trained bats. Data points for different bats are indicated by different symbols and colors. Fits for each bat are shown (Weibull fit).

