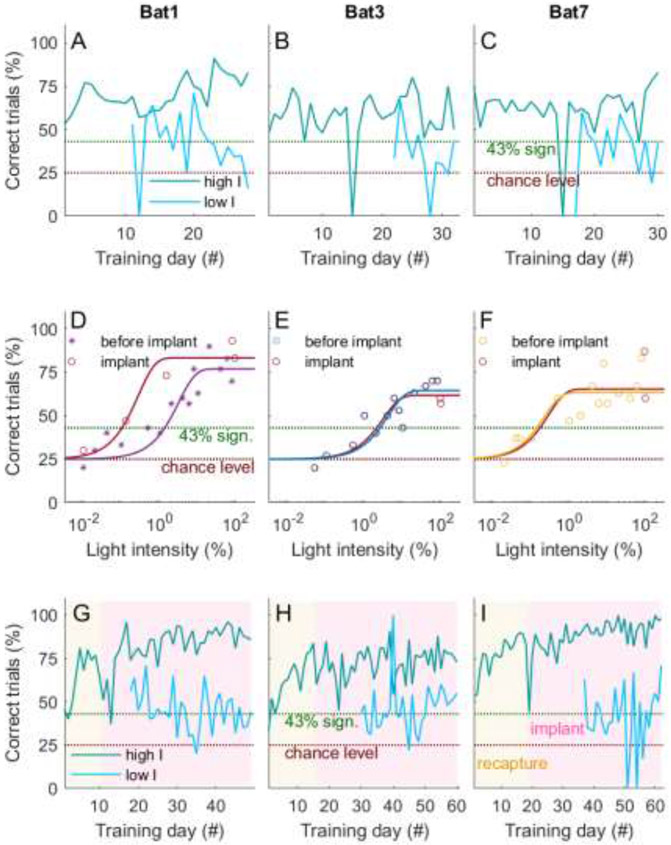
Fig 3: Training consistency and psychometric functions before and after implant.
(A-C) Shown are the performance curves (% of correct trials) for the three implanted bats as a function of training day. Trials are separated into high intensities (3% and above, dark cyan) and low intensities (less than 3%, cyan), as this value was slightly above the highest threshold measured for these three bats (2.6% for Bat 3). Chance level is at 25% (4-AFC) and significance at 43% (over 30 trials). During the measurement of the psychometric functions, the bats’ performance for the high intensity trials remained stable and above significance level. As expected, the performance for lower intensity levels was lower, between significance and chance, than for the higher intensity trials. The rare performance drops to 0% are due to very low trials numbers (one to a maximum of four trials) as a result of erroneous full-feed of the animals by husbandry care. (D-F) Psychometric functions for light intensities measured before and after implant are highly similar for all three bats, or even shifted towards higher sensitivities (Bat 1). Shown is performance (% of correct trials) as a function of light intensities. Data points are indicated by the symbols and are fitted by a Weibull fit (solid colored lines). (G-I) After recapture of three of the trained bats (16, six and three months, respectively) the overall performance remained reliably above significance level (indicated by the yellow background). This is also true after the implant of the microdrive (indicated by the red background), especially for the high intensity trials (dark cyan line). Shown are fraction of correct trials against training days. Bat numbers correspond to those introduced in Fig 2.

