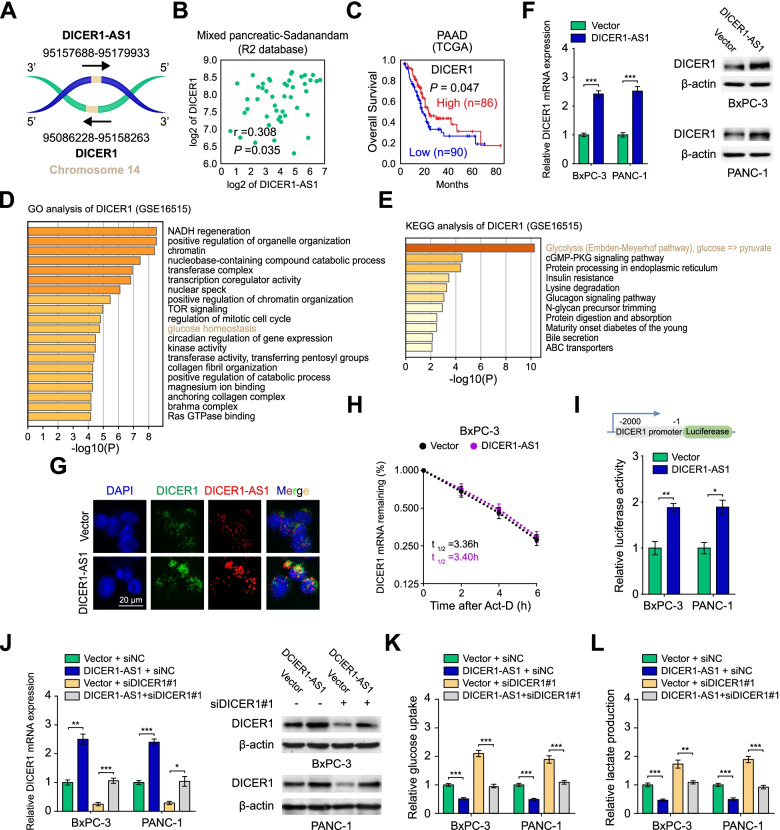
Fig. 3.
DICER1 is a critical target for DICER1-AS1 regulating glycolysis. A Schematic illustration showing the genomic location of DICER1-AS1 and DICER1. B The expression correlation between DICER1-AS1 and DICER1 in PC tissues derived from the R2 database (https://hgserver1.amc.nl/cgi-bin/r2/main.cgi). C Kaplan–Meier survival analysis of PC patients with high or low levels of DICER1 (cutoff value = 2886.20) derived from the TCGA database. D-E GO and KEGG analyses of DICER1-correlated genes in PC tissues from GEO database (GSE16515). F Real-time qRT-PCR assay (left panel) and western blot assay (right panel) showing the expression of DICER1 in BxPC-3 and PANC-1 cells transfected with control or DICER1-AS1 plasmids. (n = 3). G RNA-FISH and immunofluorescence detection of DICER1-AS1 (red) and DICER1 (green) in DICER1-AS1 overexpressed cells (BxPC-3). H The DICER1 mRNA half-life (t1/2) was detected by real-time PCR in BxPC-3 cells transfected with control vector or DICER1-AS1 plasmids. I Schematic illustration of luciferase reporter constructs used for examining the effects of DICER1-AS1 on the DICER1 promoter (upper panel). The dual-luciferase assay showing the relative activity of DICER1 promoter in BxPC-3 and PANC-1 cells transfected with control vector or DICER1-AS1 (lower panel). J Real-time qRT-PCR (left panel) and western blot assay (right panel) showing the change of transcript and protein levels of DICER1 in BxPC-3 and PANC-1 cells transfected with control or DICER1-AS1 plasmids and those co-transfected with siNC or siDICER1. K-L The relative glucose uptake levels and lactic acid production were detected in BxPC-3 and PANC-1 cells transfected with control or DICER1-AS1 plasmids and those co-transfected with siNC or siDICER1. All data were presented as means ± SD of at least three independent experiments. Values are significant at aP < 0.05, bP < 0.01 and cP < 0.001 as indicated

