Fig. 6.
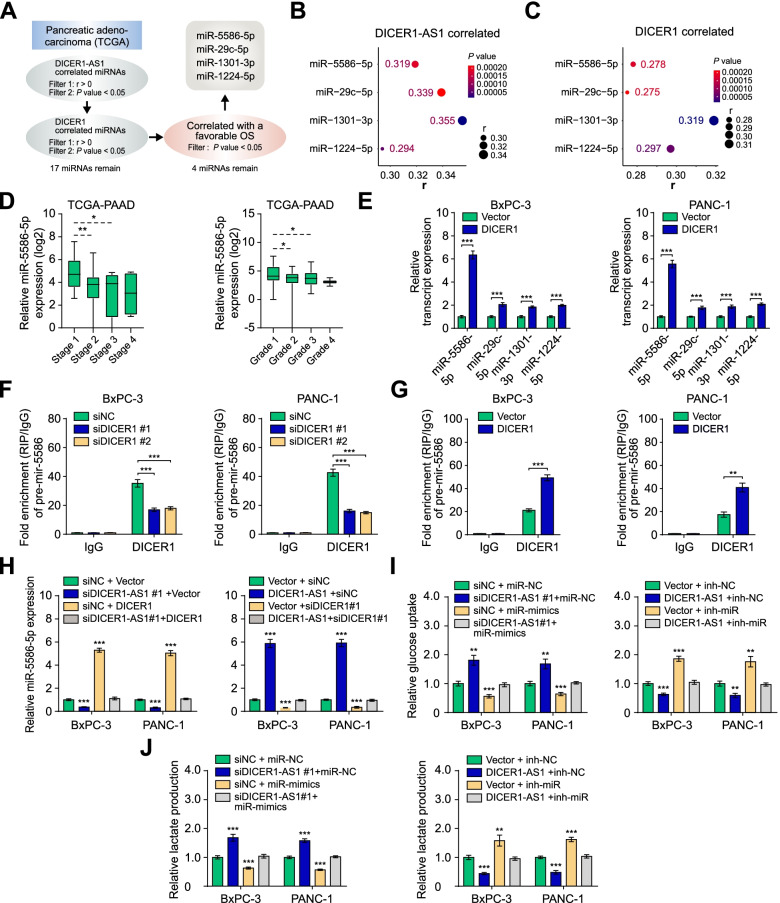
miR-5586-5p is an essential target for the DICER1-AS1/DICER1 pathway. A The flow chart for selected candidate miRNAs. B Bubble plots showing the expression correlation between DICER1-AS1 and candidate miRNAs. C Bubble plots showing the expression correlation between DICER1 and candidate miRNAs. D Boxplots showing the miR-5586-5p level in PC tissues with different statuses of stages and grades. E Real-time qRT-PCR showing the levels of candidate miRNAs in BxPC-3 and PANC-1 cells transfected with control vector or DICER1 plasmids. F RIP assays showing the binding efficiency between DICER1 protein and pre-mir-5586 using the anti-DICER1 antibody in BxPC-3 and PANC-1 cells transfected with siNC or siDICER1 (#1, #2). G RIP assays showing the binding efficiency between DICER1 protein and pre-mir-5586 using the anti-DICER1 antibody in BxPC-3 and PANC-1 cells transfected with vector control or DICER1 plasmids. H Real-time qRT-PCR showing the levels of miR-5586-5p in BxPC-3 and PANC-1 cells transfected with siNC, siDICER1-AS1, empty vector, or DICER1, and those co-transfected with empty vector, DICER1, siNC, or siDICER1. I-J The relative glucose uptake and the relative lactic acid production were detected in PC cells transfected with siNC, siDICER1-AS1, empty vector, or DICER1-AS1, and those co-transfected with miR-NC, miR-5586-5p mimics, inh-NC, or miR-5586-5p inhibitors. All data were presented as means ± SD of at least three independent experiments. Values are significant at aP < 0.05, bP < 0.01 and cP < 0.001 as indicated

