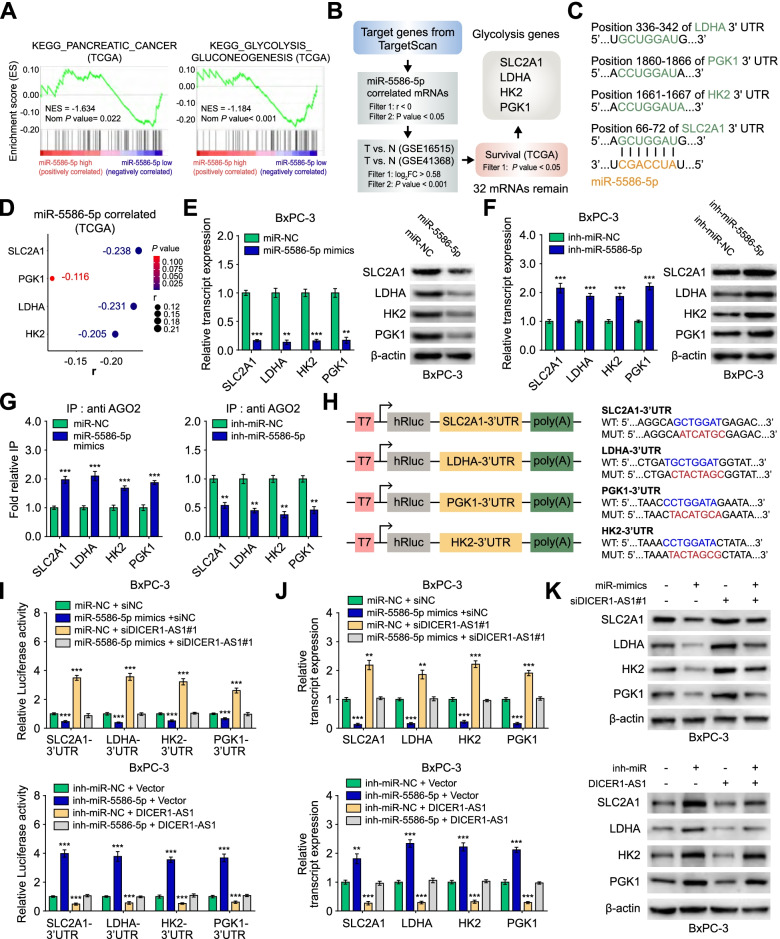
Fig. 7.
miR-5586-5p regulates glycolysis by inducing mRNA degradation of glycolytic genes. A GSEA analysis of miR-5586-5p-correlated genes derived from PC tissues (TCGA). NES, normalized enrichment score. B The flow chart for selected candidate glycolytic genes of miR-5586-5p target genes from the TargetScan database (http://www.targetscan.org/mamm_31/), and associated with overall survival of PC patients in TCGA database, and over-lapping analysis with genes differentially expressed (P < 0.001, Fold change > 1.5) in GEO database (GSE16515, GSE41368). C Schematic illustration showing the base pairing between miR-5586-5p and the 3’UTRs of glycolytic genes (SLC2A1, HK2, PGK1, LDHA) predicted by TargetScan database. D Bubble plots showing the expression correlation between miR-5586-5p and candidate glycolytic genes in PC tissues from the TCGA database. E–F Real-time qRT-PCR (left panel) and western blot (right panel) showing the levels of candidate glycolytic genes in BxPC-3 cells transfected with miR-NC, miR-5586-5p mimics, inh-miR-NC, or inh-miR-5586-5p. G RIP assays showing the effect of miR-5586-5p on the interaction of AGO2 with candidate glycolytic genes in PC cells using anti-AGO2 antibody. IgG was used as a negative control. H Schematic illustration showing the luciferase reporter constructs used for examining the effects of miR-5586-5p on the 3’UTR (WT, MUT) of SLC2A1, LDHA, HK2, and PGK1. WT: wild type; MUT: mutant type. I The dual-luciferase assay showing the luciferase reporter activity of 3’UTR of candidate glycolytic genes in BxPC-3 cells transfected with miR-NC, miR-5586-5p mimics, inh-miR-NC or inh-miR-NC, and those co-transfected with siNC, siDICER1-AS1, empty vector, or DICER1-AS1. J-K qRT-PCR and western blot showing the levels of glycolytic genes in BxPC-3 cells transfected with miR-NC, miR-5586-5p mimics, inh-miR-NC, or inh-miR-NC, and those co-transfected with siNC, siDICER1-AS1, empty vector, or DICER1-AS1. All data were presented as means ± SD of at least three independent experiments. Values are significant at aP < 0.05, bP < 0.01 and cP < 0.001 as indicated

