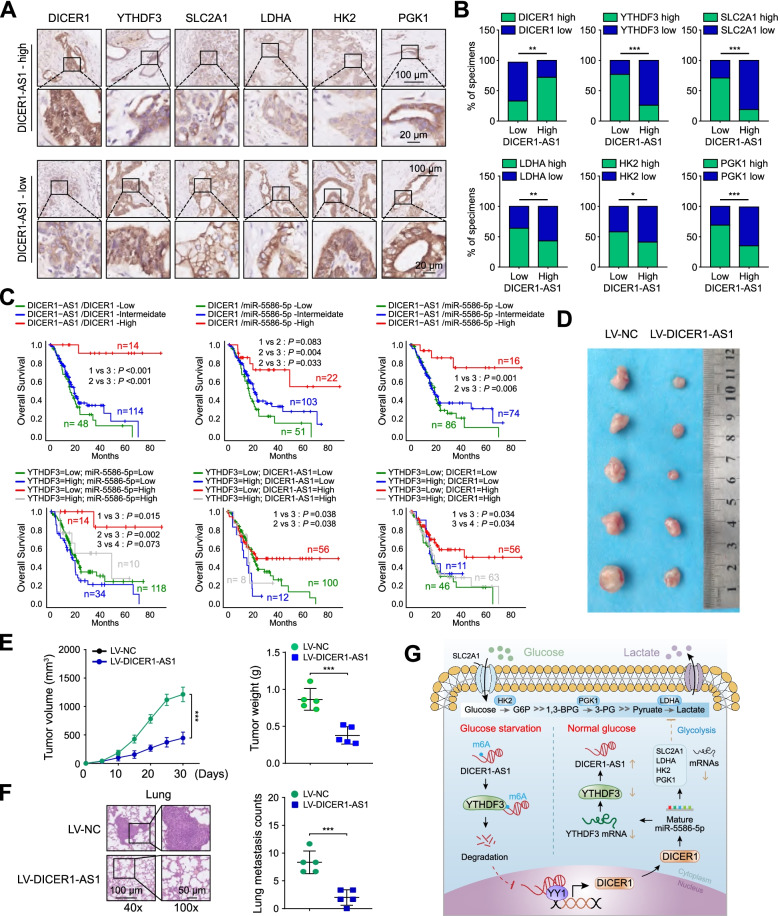
Fig. 9.
YTHDF3/DICER1-AS1/DICER1/miR-5586-5p axis is pivotal for glycolysis and tumorigenesis of PC. A The representative IHC images of DICER1, YTHDF3, SLC2A1, LDHA, HK2, and PGK1 in PC tissues (n = 86) with low or high levels of DICER1-AS1. Scale bar, 100 μm. B Statistical analyses (Chi-square test) showing the different levels of DICER1, YTHDF3, SLC2A1, LDHA, HK2, and PGK1 in PC tissues with high or low DICER1-AS1 levels. C Kaplan–Meier analysis (log-rank test) showing the OS curves based on the different groups of PC patients (TCGA database) with different levels of DICER1-AS1, DICER1, miR-5586-5p, and YTHDF3. D The images of xenografts formed by subcutaneous injection of BxPC-3 cells transfected with LV-NC or LV-DICER1-AS1. E The volume of the subcutaneous tumor was measured every 5 days in indicated groups (left panel). The weight of subcutaneous tumor was measured in the indicated groups after mice were sacrificed (right panel). F The representative HE staining images (left panel) and quantification (right panel) of lung tissues were isolated from indicated groups. The nude mice were treated with tail vein injection of BxPC-3 cells transfected with LV-NC or LV-DICER1-AS1. G Schematic representation for the mechanism of YTHDF3/DICER1-AS1/DICER1/miR-5586-5p axis as a switch that regulates glycolysis in pancreatic cancer by stabilizing the glycolytic genes under glucose deprivation. All data were presented as means ± SD of at least three independent experiments. Values are significant at aP < 0.05, bP < 0.01 and cP < 0.001 as indicated

