Fig. 5.
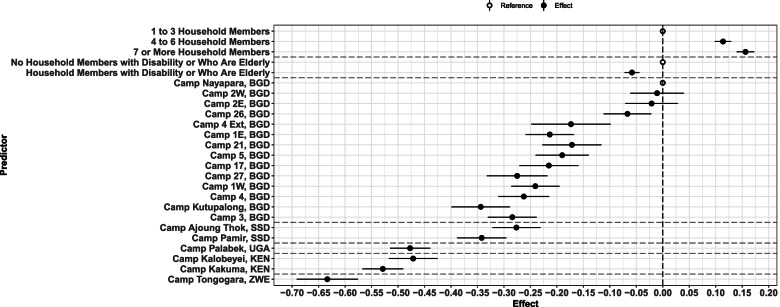
Multivariate Association with Female WASH Index Among 20 Refugee Camps Households in 2019. This graph illustrates the multivariate association with Female WASH Access Index among social and geographic stratifiers in 20 refugee camps households with at least one woman of reproductive age in 2019. On the y axis, are the social or geographic predictors, the name of each refugee camp is followed by the abbreviation of the settlement country. On the x axis the effect, outlined by the dotted line that represents the zero effect. Black points represent effects and white points references. The horizontal lines that cross each black point represents the CI95%. Kyangwali, Uganda refugee camp is not included in the multivariate logistic regression. This figure was created from the Standardized WASH KAP Surveys, UNHCR, 2019

