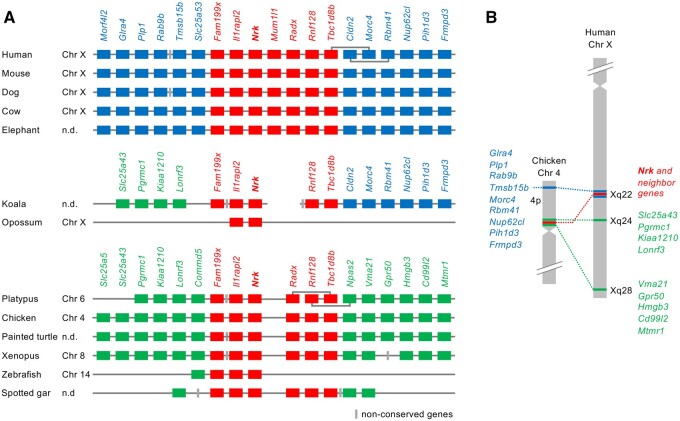
Fig. 1.
Synteny analysis of the Nrk gene. (A) Synteny conservation of the region surrounding the Nrk gene. Red, blue, and green boxes indicate syntenic genes across vertebrates, eutherians, and those observed only in platypus and nonmammals, respectively. Gray boxes indicate nonconserved genes. (B) Loci of Nrk and syntenic genes in chicken and human chromosomes.

