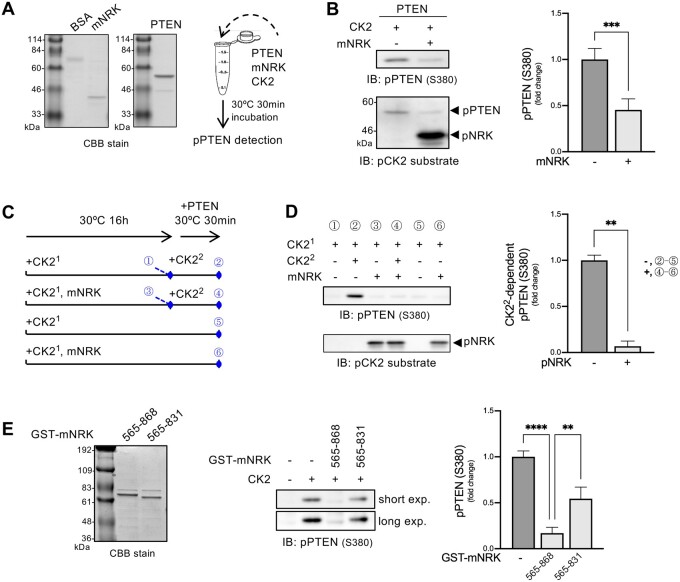
Fig. 6.
Effects of the middle region of mNRK on CK2 kinase activity. (A) CBB staining of purified mNRK565–868 and GST-PTEN190–403 and schematic representation of in vitro kinase assay in (B). (B) Inhibition of CK2 activity by mNRK565–868. CK2, GST-PTEN190–403, and mNRK565–868 were mixed in a kinase assay buffer containing ATP and incubated at 30 °C for 30 min. The samples were then subjected to immunoblotting, followed by densitometric analyses. The graph shows the mean ± SD of four independent experiments. ***P ≤ 0.001 (unpaired two-tailed Student’s t-test). (C) Schematic representation of the in vitro kinase assay and the sampling time of each sample (#1–6) shown in (D). (D) mNRK565–868 inhibition of CK2 activity via a noncompetitive mechanism. mNRK565–868 was phosphorylated by preincubation with CK2 (denoted as CK21) in a kinase assay buffer containing ATP at 30 °C for 16 h. The samples were then mixed with CK2 (denoted as CK22), GST-PTEN190–403, and ATP and incubated at 30 °C for 30 min, followed by immunoblotting and densitometric analyses. We subtracted the value of sample #5 from sample #2 and sample #6 from sample #4, marking them as those with phosphorylation of PTEN by CK22 in the absence or presence of phospho-NRK in the graph, respectively. The graph shows the mean ± SD of four independent experiments. **P ≤ 0.01 (unpaired two-tailed Student’s t-test). (E) Importance of the region comprising aa 832–868 for maximum inhibition of CK2 activity by mNRK565–831. CK2, GST-PTEN190–403, and GST-mNRK (mNRK565–868 or mNRK565–831) were mixed in a kinase assay buffer containing ATP and incubated at 30 °C for 30 min. The samples were then subjected to immunoblotting, followed by densitometric analyses. The graph shows the mean ± SD of three independent experiments. **P ≤ 0.01; ****P ≤ 0.0001 (one-way analysis of variance [ANOVA], followed by Tukey’s multiple comparisons test).

