Fig. 2.
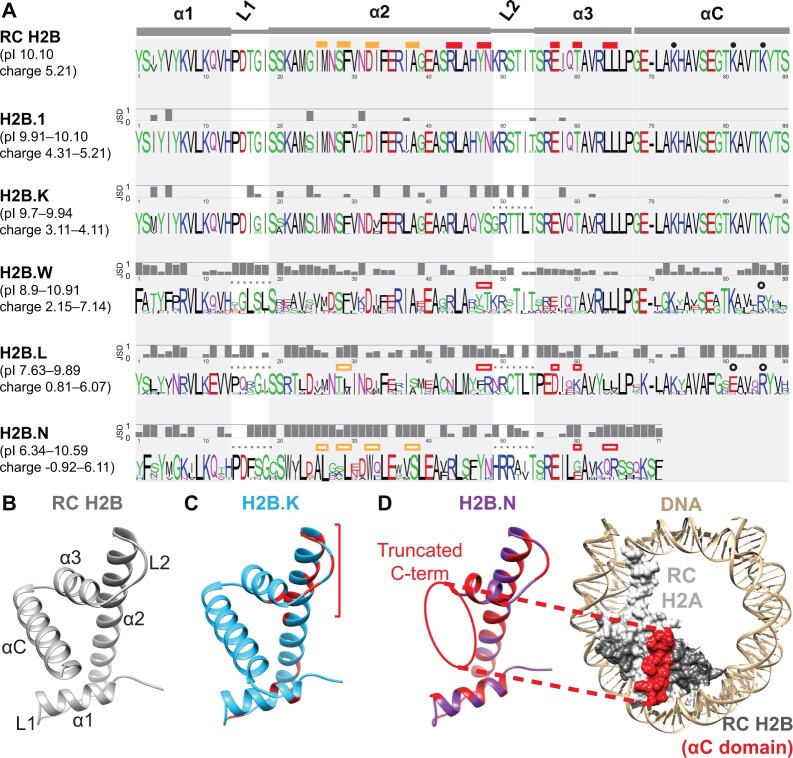
H2B variants diverge from RC H2B and each other in many protein features. (A) Logo plots depicting protein alignments of the HFD (α1, L1, α2, L2, α3) and αC domain of RC H2B and H2B variants across an identical set of representative mammals (see Materials and Methods). Colors of residues highlight their biochemical properties: hydrophobic (black), positively charged (blue), negatively charged (red), polar (green), and others (magenta). JSD at each amino acid position were calculated between RC H2B and each H2B variant. Low JSD values indicate low divergence between RC H2B and variant H2Bs, whereas high JSD values indicate that RC H2B and H2B variants have distinct residues. Above the RC H2B logo, we indicate residues that interact with H2A (filled yellow boxes) or H4 (filled red boxes) and residues that are posttranslationally modified (filled circles) (Luger et al. 1997; McGinty and Tan 2021). Changes at these positions in H2B variants are indicated above each logo plot with empty boxes/circles, and loop regions with altered residues are indicated with a dotted line. The ranges of isoelectric points (pI) and charge across orthologs of each variant are shown in parentheses on the left. Note that H2B.N orthologs are missing most of the αC domain. See supplementary figure S7B, Supplementary Material online, for Logo plots depicting protein alignments of the N-terminal tail across the same set of representative mammals. (B) Structure of the HFD and αC domain of human RC H2B (Arimura et al. 2018). The N and C termini are unstructured. (C) Homology model of human H2B.K (blue) indicates a cluster of red sites (bracket) that differ from RC H2B (see Materials and Methods). (D) A homology model of human H2B.N (left, purple) with sites that differ from RC H2B highlighted in red (see Materials and Methods). RC H2A-H2B within a nucleosome (PDB:5y0c; Arimura et al. 2018) is shown on the right, with DNA (tan), RC H2A (light gray), and RC H2B (dark gray) surfaces and the RC H2B αC domain (red) highlighted.

