Fig. 5.
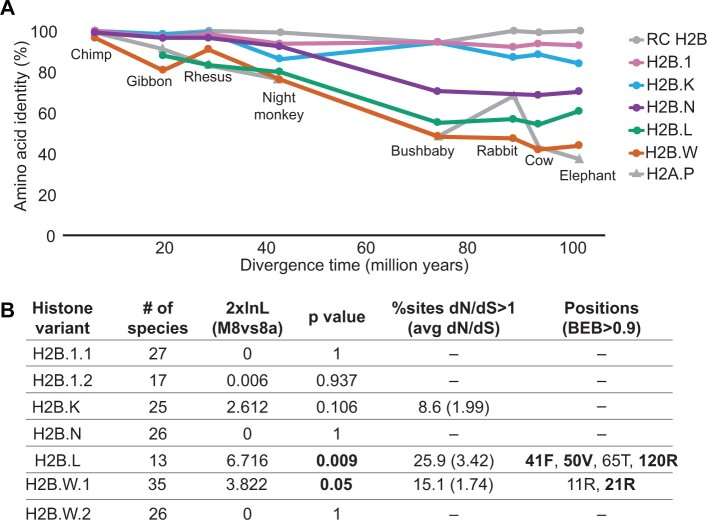
Evolutionary tempo of H2B variants in mammals. (A) Pairwise amino acid identity of H2Bs and H2A.P (Molaro et al. 2018) showing comparisons of specified mammal orthologs versus either the human or orangutan (for H2B.L) ortholog of each H2B variant. Percent identities (y axis) are plotted against species divergence time (x axis). For H2B variants with multiple copies, the copy with the highest identity to the human ortholog was used (see supplementary table S2, Supplementary Material online; Materials and Methods) to be conservative. (B) PAML analyses were used to look for site-specific positive selection (supplementary table S4, Supplementary Material online). Log likelihood differences and P values from the Model 8 versus Model 8a comparison are indicated. For the variants where likelihood tests suggest the presence of positive selection, the percentage of sites with dN/dS>1 is shown, along with the estimated average dN/dS for those sites. The “Positions” column lists positively selected sites (M8 BEB>0.9); sites also identified by FUBAR analyses are highlighted in boldface (Murrell et al. 2013). Amino acid residues shown correspond to the rhesus macaque protein sequence. See supplementary figure S13, Supplementary Material online, for alignments showing positively selected residues.

