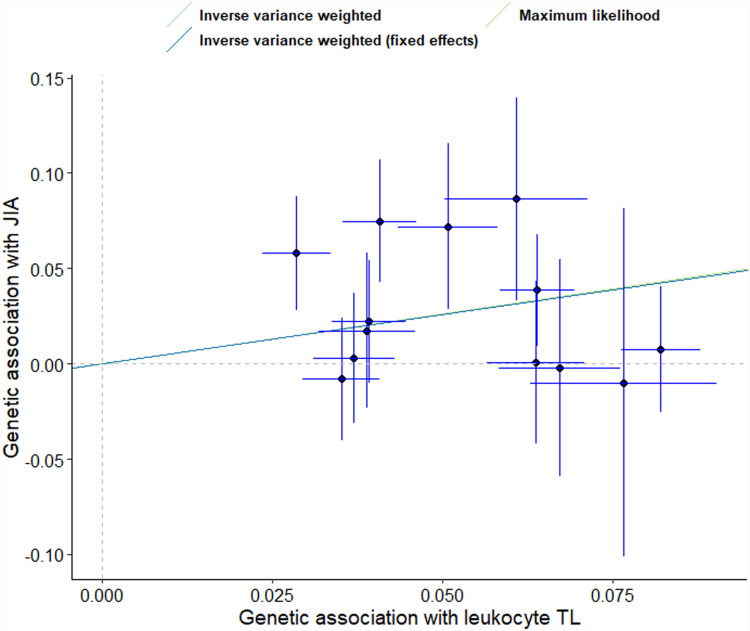
Figure 2.
Scatter plot of the effect size and 95% CIs of each SNP on leukocyte TL and JIA risk. The horizontal axis represents genetic associations of each variant on leukocyte TL. The vertical axis indicates the genetic association of each SNP with risk of JIA.
Abbreviations: SNP, single-nucleotide polymorphism; TL, telomere length; JIA, juvenile idiopathic arthritis.

