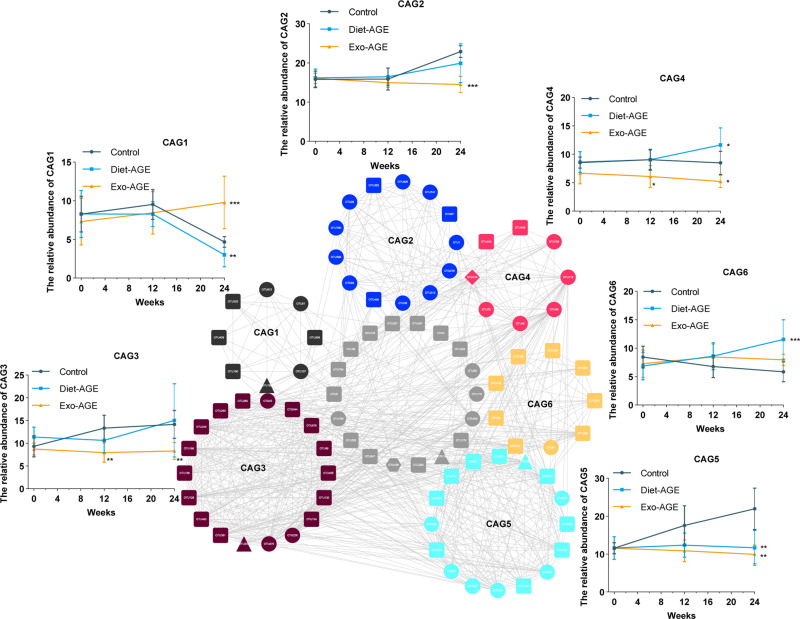
Figure 3.
Changes among the six co-abundance groups (CAGs) in the gut microbiota of mice fed high-AGE diets for 24 weeks. Different node colors and shapes represent different CAGs and phyla, respectively. Round, square, triangle, diamond, hexagon, and octagon represent Bacteroidetes, Firmicutes, Proteobacteria, Actinobacteria, Tenericutes, and Cyanobacteria, respectively. The relative abundance of each CAG was summed from the relative abundance of the included operational taxonomic units (OTUs) in all samples of each group. *p < 0.05; **p < 0.01; ***p < 0.001 for comparison with the control group at the same time point.
Abbreviations: AGE, advanced glycation end product; Diet-AGE, dietary AGE group; Exo-AGE, exogenous AGE group.

