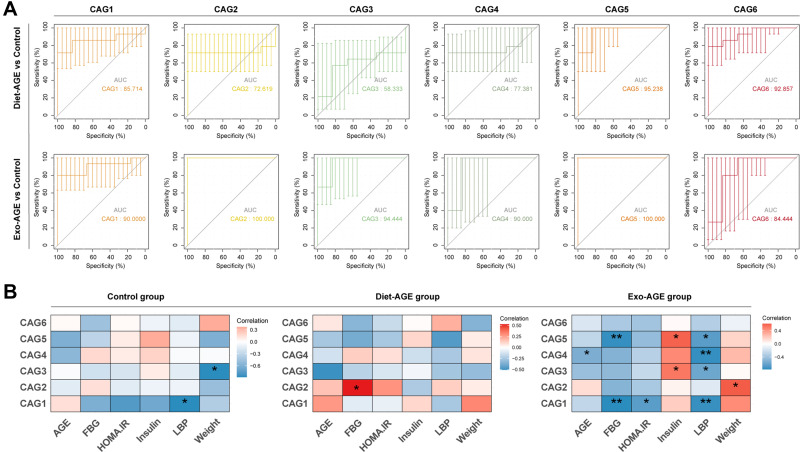
Figure 4.
Correlation analysis between co-abundance groups (CAGs) and clinical phenotype in the three groups. (A) Receiver operating characteristic (ROC) curves were applied to assess the ability of the six CAGs to discriminate between the high-AGE diet and control groups. (B) Heatmap of correlations between CAGs and clinical phenotype in the three groups. The color represents the level of correlation: red, positive correlation; blue, negative correlation. *p < 0.05; **p < 0.01.
Abbreviations: AGE, advanced glycation end product; FBG, fasting blood glucose; HOMA-IR, homeostatic model assessment insulin resistance; LBP, lipopolysaccharide-binding protein; Diet-AGE, dietary AGE group; Exo-AGE, exogenous AGE group.

