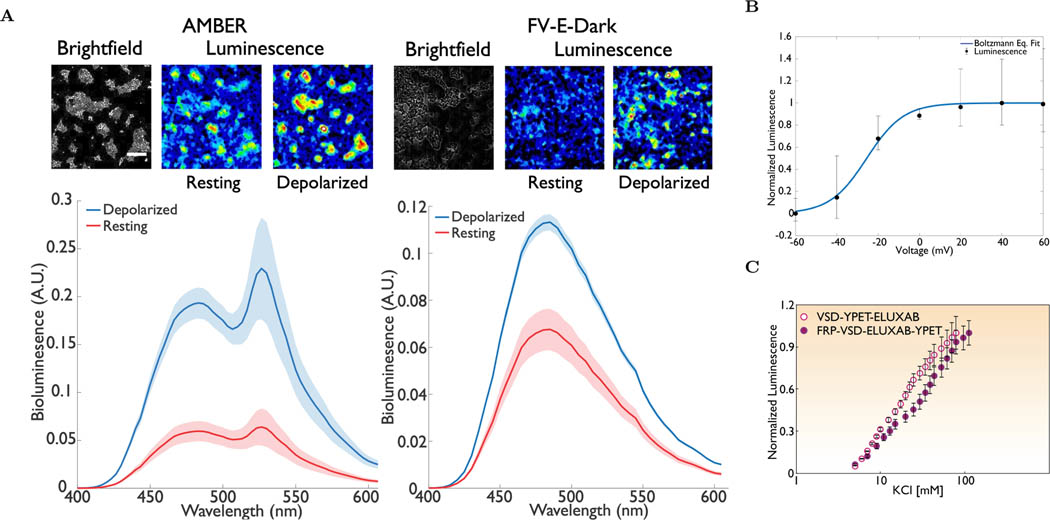
Figure 2:
Spectral emission and voltage response of AMBER. (A, left) Representative micrographs (top) and the bioluminescent emission spectrum (bottom) of AMBER at the resting and KCl induced depolarization states (Wilcoxon signed-Rank test; n > 25 cells; p <10−5). A ≈ 3-fold increase in the average signal was observed after KCl addition. There was negligible difference in the ratio of the donor (λex=490nm) to acceptor (λem=530nm) signals before and after KCl addition. Shaded region represents 95% confidence interval. (A, Right) Representative micrographs (top) and the bioluminescent emission spectrum (bottom) of FV-E-Dark at the resting and KCl induced depolarization states. Beta barrel of the Dark mutant is sufficient to switch the activity of eluxAB domain. The loss of BRET component is evident from the decreased brightness of the micrographs. Shaded region represents 95% confidence interval. (B) Representative whole cell voltage clamp recording of a HEK293 cell expressing AMBER. Recordings from six independent repeats varying the membrane potential between −60mV and 60mV at an increment of 20mV were plotted. Electrically stimulated optical readout follows the classical Boltzmann distribution with V1/2 ≈ −25mV. The Boltzmann equation (1/(1 + exp(−q(V − V1/2)/zQkBT))) fit yields a value of V1/2 = −25.5 ± 1mV and a zQ ≈ 3 ± 0.25. A single tailed paired t-test statistic confirms statistically significant difference between the mean intensities corresponding to the off and on states (Shapiro Wilk normality p-value ≈ 0.562 > Significance level, α = 0.05, single tailed paired t-test p < 0.02). AMBER shows approximately ≈3X increase in luminescence in experiments performed on HEK293T. (C) Normalized bioluminescent response of the AMBER and VY-E under KCl titration. An order of magnitude change in the extracellular KCl concentration is necessary to achieve the maximum intensity for the chosen constructs. For both the patch clamp and KCl depolarization experiments the luminescence is the total light collected over all wavelengths. Scale bar length is 200μm.

