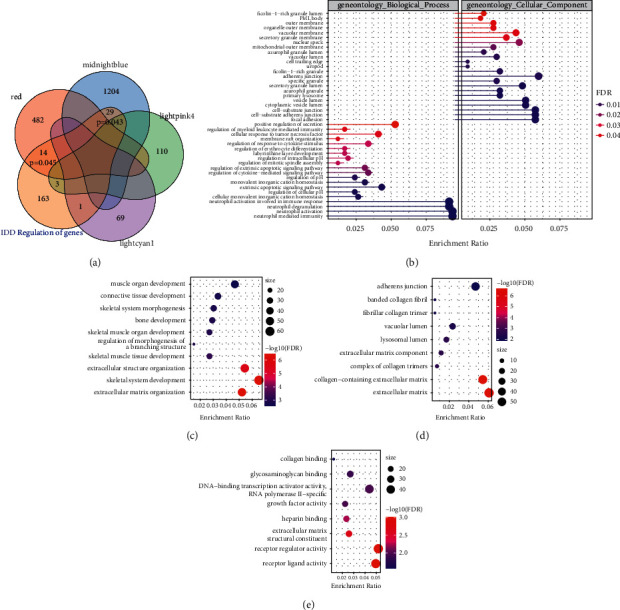
Figure 3.

Functional analysis of IDD-related modules. (a) Winn diagram of intersection between genes in four IDD-related modules and known regulatory genes of IDD. (b) GO Biological Process and Cellular Component enriched by genes in the Red module. (c) The most significant 10 bcCellular components enriched by the MidnightBlue module. (c) The most significant 10 molecular functions enriched in the MidnightBlue module. The dot size in the figure represents the number of module genes enriched in term. Color denotes significance FDR.
