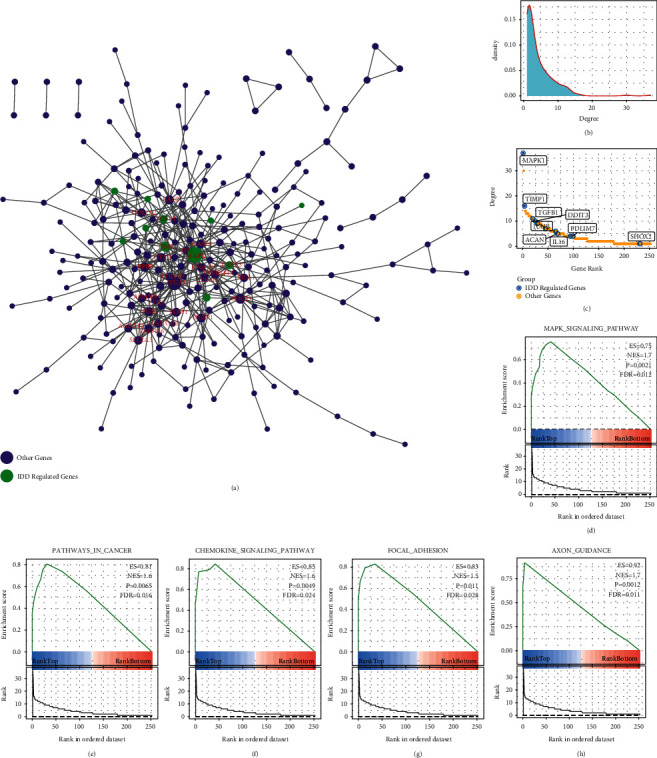
Figure 4.

Analysis of IDD-specific protein interaction networks. (a) IDD-specific protein interaction networks. (b) Degree distribution of the network. (c) Degree rank of each node in the network, marked as IDDRG; D-H: the KEGG pathway is enriched by ranked GSEAs in the network.
