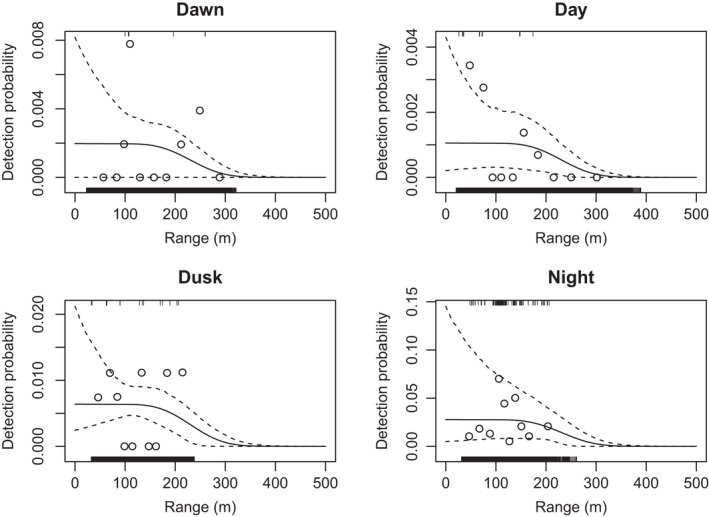
FIGURE 5.

Detection function for free‐swimming porpoise from the tracking experiment. Estimated probability of detection (solid lines) and 95% bootstrap confidence limits (dashed lines) of tracked harbour porpoise in a 1‐s period in each diel phase as a function of horizontal distance. Vertical ticks at the top and bottom of each plot show the raw data: ranges at which detections were made in a 1‐s period (top of plot) or at which detections were not made (bottom of plot). Circles show a summary of these data: the proportion of positive detections in ten distance bands equally spaced through the data. The shape of the detection function (on the scale of the logit link) was constrained to be the same in all diel phases, and the function was constrained to be zero at 500 m. Note the different scales on the y‐axes
