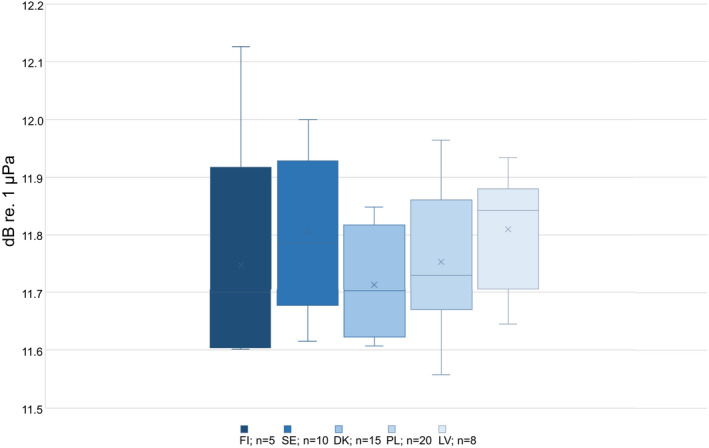
FIGURE A1.1.

Detection thresholds for selected C‐PODs estimated by playback data. Detection threshold by country for a total of 58 selected C‐PODs; FI = Finland, SE = Sweden, DK = Denmark, PL = Poland, LV = Latvia. Whiskers, max and min; box, 25th and 75th quartiles; cross, mean; horizontal line, median
