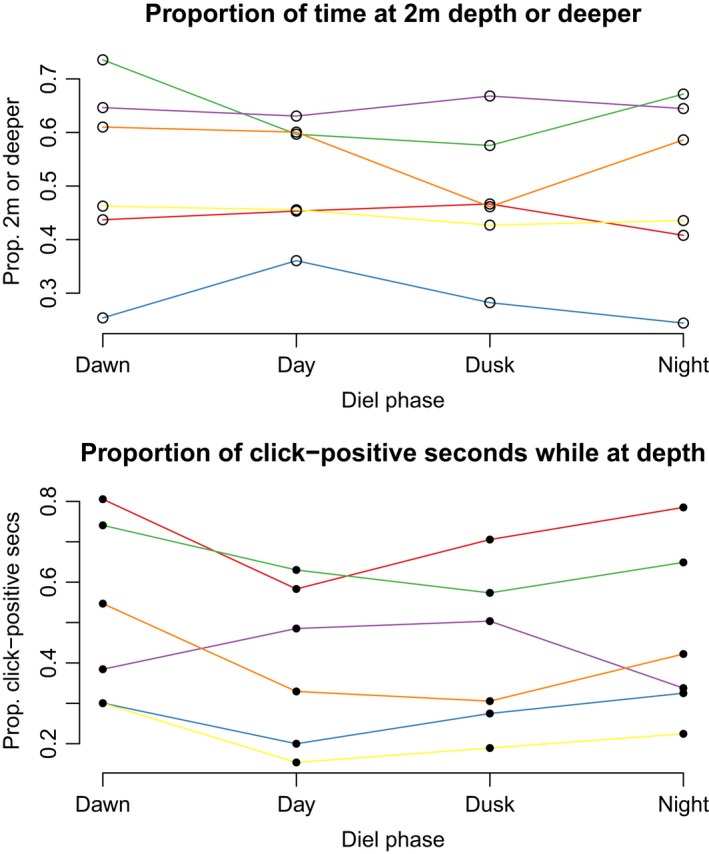
FIGURE A3.1.

Top panel: proportion of time spent at depths of 2 m or deeper by diel phase for 6 tagged harbour porpoise. Bottom panel: proportion of click‐positive seconds by diel phase for 6 tagged harbour porpoise; in this plot, only records where the tag was at depth of 2 m or deeper were used
