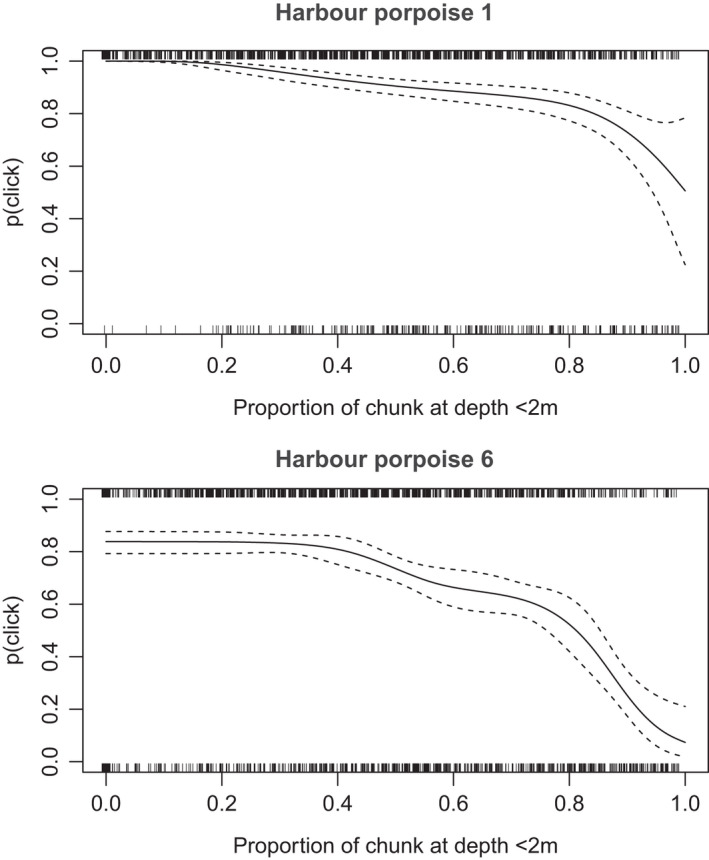
FIGURE A4.4.

Examples of binary regression on harbour porpoise tag data to correct for missing data. Missing data were caused by truncation of data from depths <2 m. Shown here are the results for harbour porpoise 1 (top) and harbour porpoise 6 (bottom), with data collected into chunks of 54 s (the median tracking event duration). Short vertical lines at the top and bottom of each plot show the proportion of each chunk of 54 s that had depths <2 m in it (lines are horizontally jittered for clarity); lines at the top represent chunks where there was at least one porpoise click‐positive second (CPS) and lines at the bottom are chunks with no CPS. The binary regression yielded an estimate of how probability of detecting one or more CPS (p(click) on y‐axis) varied as a function of the proportion of data at depth <2 m (solid line on plot, with accompanying 95% confidence interval shows as dashed lines). We used this regression to estimate the probability of a CPS for that chunk duration if there were no missing data—in this example, this is 1.0 for harbour porpoise 1 and 0.82 for harbour porpoise 6
