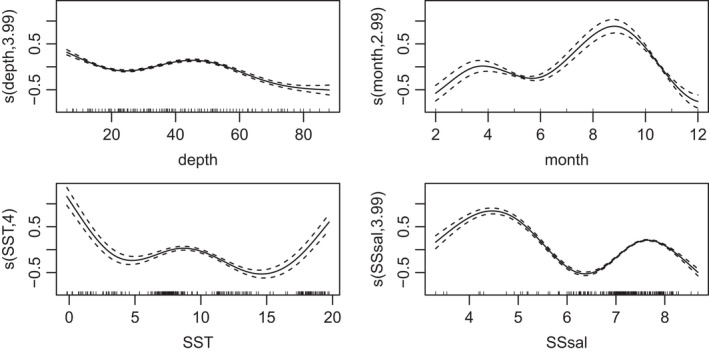
FIGURE A4.6.

Estimated smooths in the model of playback experiments in the main study area. Solid lines show estimated smooths and dashed lines approximate 95% confidence intervals from 1‐dimensional smooth terms. Smooths are shown on the scale of the (logit) link function. Explanations for each term are given in Table A5.1. Numbers on the y‐axis after the term name indicate the equivalent degrees of freedom estimated for the smooth (with a maximum of 4). Small vertical lines inside the x‐axis indicate the location of data values
