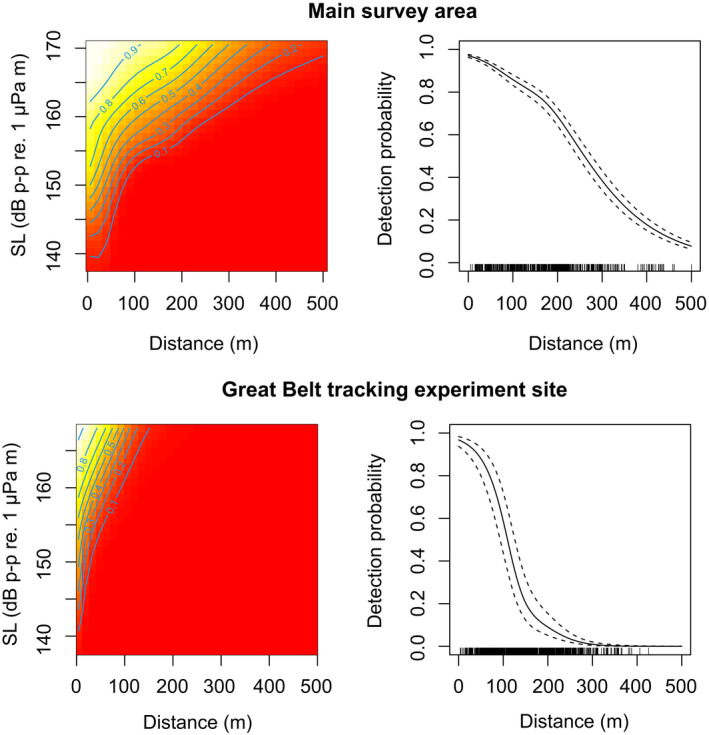
FIGURE A4.7.

Estimated 2‐dimensional smooth for variables distance and peak‐to‐peak source level (SLp‐p) in the model of playback experiments. Top panel shows smooths in the main survey area and bottom panel in the Great Belt tracking experiment site. Plots are shown on the scale of the response (i.e., probability of detecting an individual click). Top plots are for sediment type (geo variable) “sand to muddy sand,” the most common type, and median values for the other variables. Bottom plots are for random effects values of zero. For both top and bottom plots, the left contour plot shows the 2‐dimensional function, with contour lines and shading indicating detection probability (red shading shows higher detection probability through to white showing lower probability). The right line plot shows the estimated effect (solid line) of distance and approximate 95% confidence interval (dashed lines) given a peak‐to‐peak source level of 168 dB re 1 µPa m (the value used to calculate effective detection area). Small vertical lines inside the x‐axis indicate the location of distances where playbacks were performed
