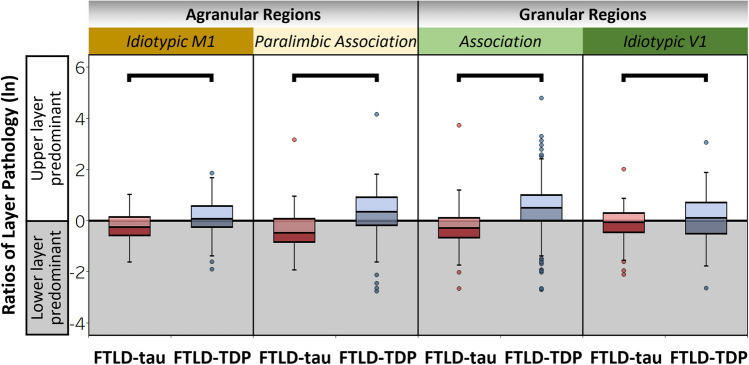
Fig. 5.
Distinct laminar distributions of tau and TDP-43 pathology are consistent across regions with varied cytoarchitecture and function. Ratios of layer pathology in regions with varied microstructure and function. Total FTLD-tau and total FTLD-TDP groups displayed significant differences in ratios of layer pathology in each type of agranular and granular region examined, including idiotypic M1 (β = -0.34, SE = 0.12, p = 0.004), paralimbic association regions (β = -0.81, SE = 0.19, p < 0.001), association regions (β = -0.71, SE = 0.08, p < 0.001), and idiotypic V1 (β = -0.29, SE = 0.14, p = 0.037). Boxplots represent ratios of layer pathology per region of each patient

