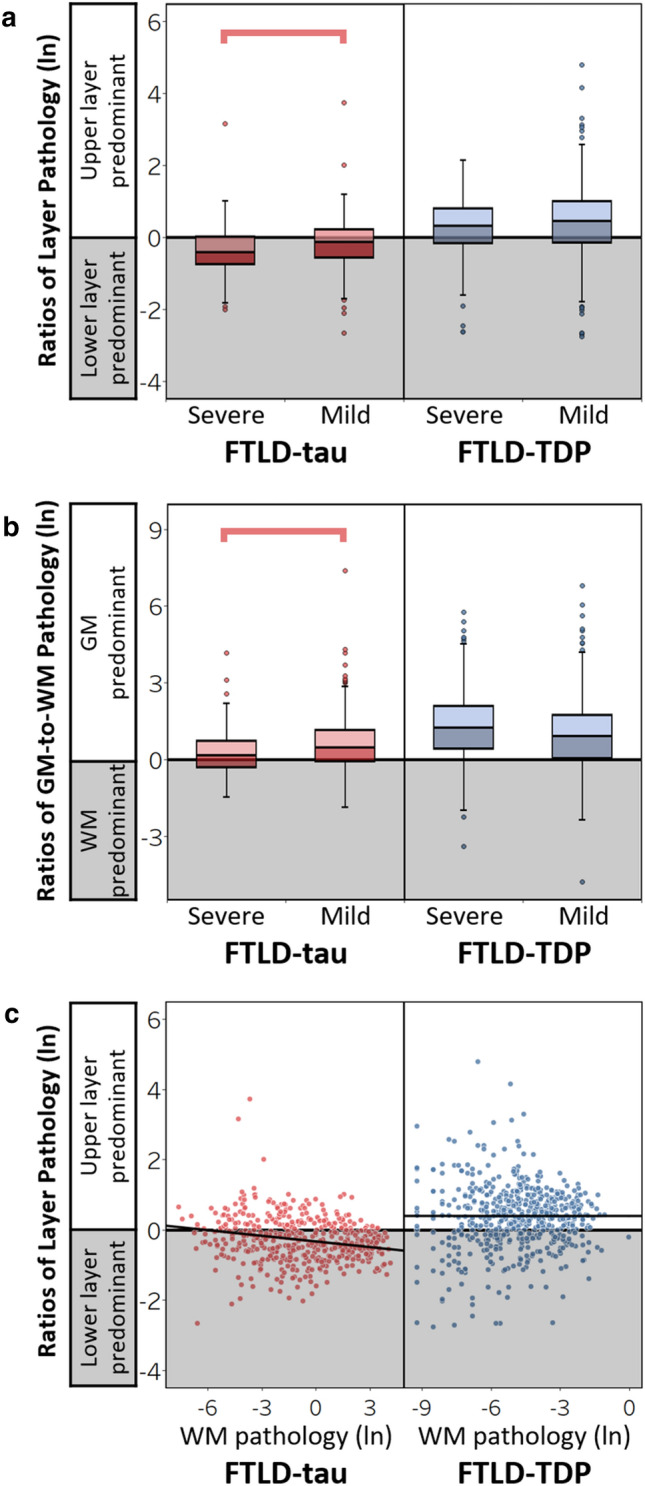
Fig. 6.

Laminar distributions of pathology in relation to regional disease severity and juxtacortical white matter in FTLD-tau and FTLD-TDP. (a) Ratios of layer pathology by regions with severe or mild pathologic burden in total FTLD-tau and FTLD-TDP. In FTLD-tau, severe pathology regions displayed lower ratios of tau pathology compared to mild pathology regions (β = -0.20, SE = 0.07, p = 0.006). In FTLD-TDP, however, higher ratios of layer pathology were similar between mild and severe pathology regions (β = -0.10, SE = 0.10, p = 0.309). (b) Ratios of GM-to-WM pathology by regions with severe or mild pathologic burden in total FTLD-tau and FTLD-TDP. In FTLD-tau, severe pathology regions displayed lower ratios of GM-to-WM pathology compared to mild pathology regions (β = -0.34, SE = 0.10, p = 0.001). In FTLD-TDP, however, similar higher ratios of GM-to-WM pathology were displayed in severe and mild pathology regions (β = 0.17, SE = 0.14, p = 0.228). (c) Greater WM tau pathology was associated with lower ratios of layer pathology in FTLD-tau (β = -0.05, SE = 0.02, p = 0.001), whereas there was no relationship between WM TDP-43 pathology and the ratio of layer pathology in FTLD-TDP (β = -0.003, SE = 0.02, p = 0.90). Lines represent the predicted ratios of layer pathology as a function of WM pathology controlling for covariates in each model (i.e., hemisphere, region, age at death, and disease duration). Boxplots and scatterplots represent ratios of layer pathology per region of each patient
