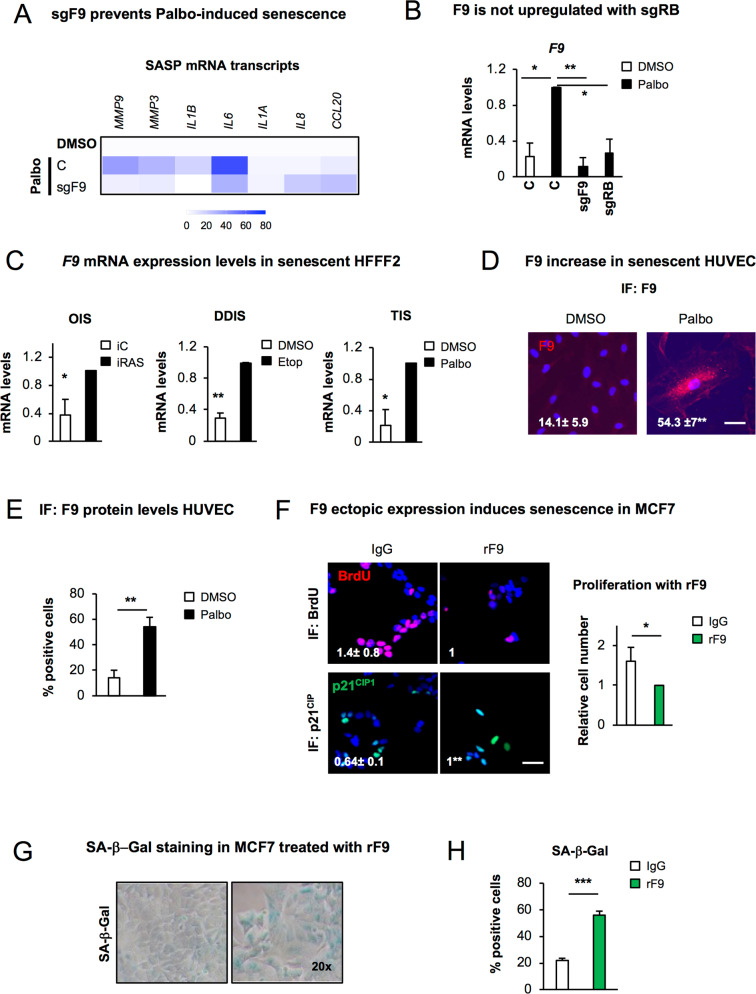
Fig. 3. F9 induces senescence and it is endogenously upregulated during senescence.
A Heat map of SASP mRNA levels in MCF7 cells control or expressing sgF9 after 20 days treatment with Palbo. The mean of 2–7 independent biological replicates is shown. B F9 mRNA upregulation by Palbo is prevented when RB is not present (sgRB). Data show the mean ± SEM of 4 independent experiments. One-WAY ANOVA with Dunnett’s multiple comparison to Palbo sample was performed. C mRNA levels of endogenous F9 mRNA levels in HFFF2 (human primary fibroblasts) upon the induction of senescence. OIS (Oncogene-induced senescence) was induced in HFFF2 expressing ER:H-RASG12V (iRAS) by adding 200 nM 4OHT for 6 days (left panel); 50μM etoposide was added for 2 days and washed out until day 7 to induce DDIS (DNA-damage senescence) (middle panel); TIS (Therapy-induced senescence) was mimicked by treating with 1μM of Palbo for 7 days (right panel). Data represent the mean ± SEM of 3 independent experiments for OIS and DDIS and 2 for TIS. Two-tailed student’s t-test analysis was performed. D Representative immunofluorescence images and E IF quantification showing the expression of endogenous F9 (red) in HUVEC (human umbilical vein endothelial cells) upon 7 days treatment with 500 nM Palbo. Scale bar: 50μm. The data represent the mean ± SEM of 4 independent experiments. Two-tailed student´s t-test was used to calculate statistical significance. F Left panel, Representative images for BrdU (red) and p21CIP1 (green) in MCF7 treated twice with 10μg/mL of recombinant F9 (rF9) for 6 days. Scale bar: 50 μm. 3 independent experiments were performed. Right panel, The graph shows a reduction in the number of cells at the end of the experiment. Mean ± SD of 3 independent experiments is shown. Two-tailed student´s t-test was used to determine statistical significance. G Representative pictures and H quantification of MCF7 cells staining positive for SA-β-Gal activity when treated twice with 10μg/mL rF9. Data represent mean ± SEM of 3 independent experiments. Two-tailed student´s t-test was used. See also Fig. S3.

