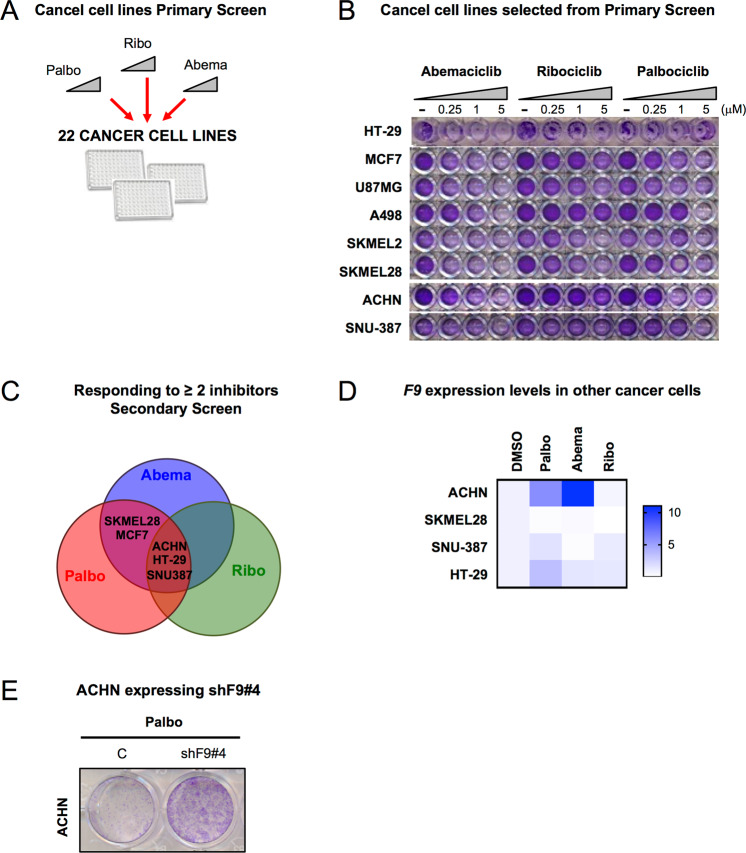
Fig. 5. CDK4/6 inhibitor response in a panel of different cancer cell lines.
A A panel of 22 cancer cell lines of different origins were treated with increasing concentrations of Palbo, Ribo and Abema. B Crystal violet staining showing the 8 cancer cell lines that responded in a statistically significant (p < 0.05) and dose-dependent manner to more than 2 inhibitors. Representative experiment is shown. C Venn diagram shows that SKMEL28 (melanoma), MCF7 (breast cancer), ACHN (renal adenocarcinoma), HT-29 (colon) and SNU-387 (liver) cancer cell lines responded to two or more CDK4/6/ inhibitors (p < 0.05) in a Secondary Screen and were selected for further validation. D Heat map showing F9 mRNA expression in the indicated cancer cells after treatment with different CDK4/6 inhibitors. The map represents the mean of 3–5 independent replicates. E ACHN control or expressing shF9#4 stained with crystal violet after 20 days treatment with Palbo show a partial proliferation bypass. See also Fig. S5.

