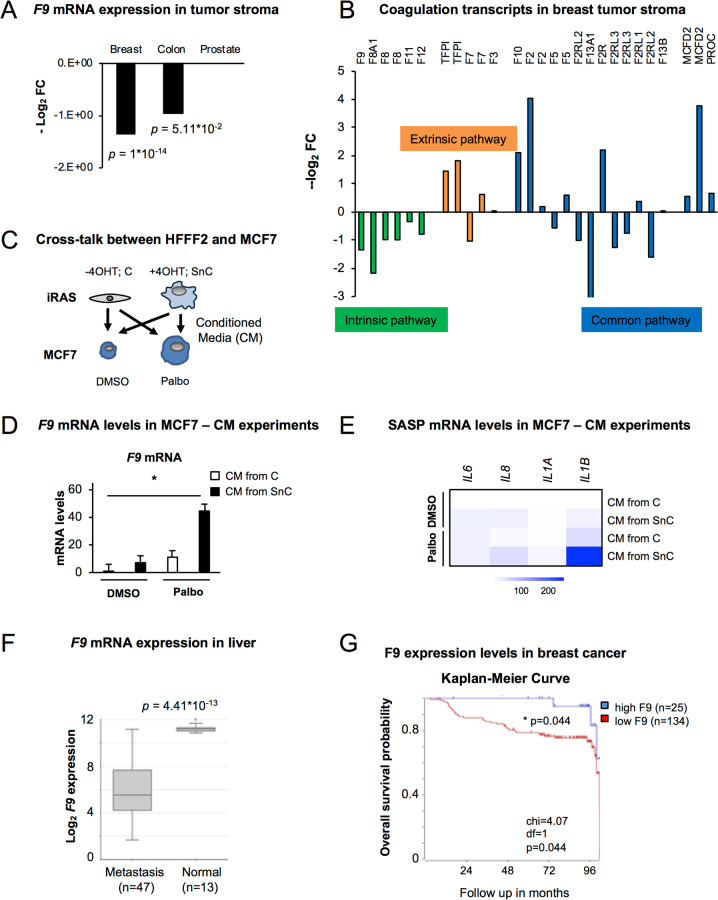
Fig. 6. F9 expression is important in different tumours.
A F9 mRNA levels in tumour stroma vs healthy stroma in breast, colon and prostate cancers. Data are represented as -log2 fold change (FC) from [27]. Breast (n = 12 samples from normal versus n = 111 from tumour); colon (n = 4 samples from normal versus n = 13 from tumour); prostate (n = 10 samples from normal versus n = 8 from tumour). T-test student analyses is performed. B mRNA expression levels of different mRNA transcripts from genes implicated in the intrinsic coagulation pathway (green bars), extrinsic coagulation pathway (orange bars) and transcripts common to both pathways (blue bars) in breast cancer. Comparison of tumour stroma (n = 111) vs healthy stroma (n = 12) [27]. C Schematic representation of panels D and E. MCF7 cells pre-treated with DMSO or 500 nM Palbo were incubated for 72 h with the conditioned media (CM) of control (-4OHT) (C) or senescent (+4OHT) (SnC) iRAS HFFF2 primary fibroblasts. Senescence was induced with 200 nM 4OHT for 3 days, washed, incubated with fresh media and collected after 3 additional days. D F9 mRNA levels and E heatmap for other SASP transcripts in MCF7 pre-treated with DMSO or 500 nM Palbo and incubated with the CM from iRAS (-/+ 200 nM 4OHT; C or SnC) for 72 h. Data show the mean ± SEM of 4 independent replicates for F9 and the mean of 4 independent experiments for the SASP. Two-way ANOVA with Dunnett’s multiple comparisons analyses was performed. F F9 mRNA expression levels in liver from normal (n = 13 samples) and metastatic (n = 47) liver. One-Way ANOVA analysis was performed to determine statistical significance. Dataset was calculated using R2. G Kaplan-Meier survival curve for high (blue) (n = 25) or low (red) (n = 134) F9 expression levels and overall survival prognostic in breast cancer. Chi-square = 4.07; p = 0.04 [30]. Dataset calculated with R2.

