
FIGURE 4.
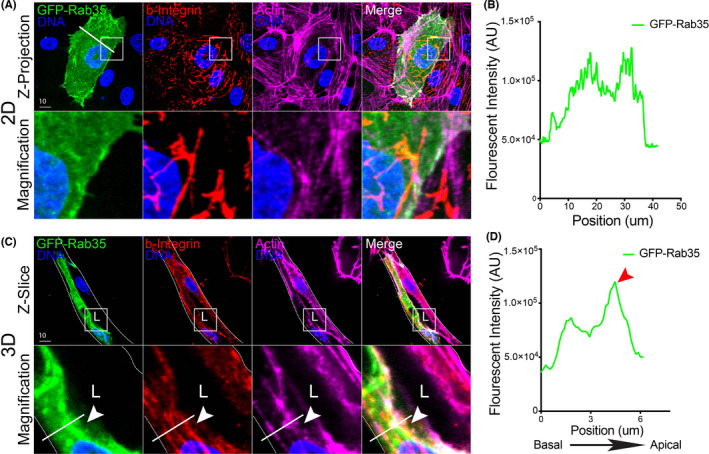
Visualizing Rab35 GTPase localization in 2D culture and 3D sprouts. (A) Representative image of endothelial cell expressing GFP‐Rab35, stained for beta‐1 integrin (b‐integrin) and actin in 2D. Lower panels are magnification. While line is line scan area. (B) Line scan of Rab35 intensity in panel (A). White line across cell in panel (A) represents line scan location. (C) Representative image of fibrin bead sprout expressing GFP‐Rab35, stained for b‐integrin and actin. Arrowhead indicates Rab35 accumulation at apical membrane. While line is line scan area. (D) Line scan of Rab35 intensity in panel (C). Red arrowhead indicates border of apical membrane. White boxes are areas of magnification and while dotted lines indicated sprout boundaries. L denotes lumen [Colour figure can be viewed at wileyonlinelibrary.com]