
FIGURE 5.
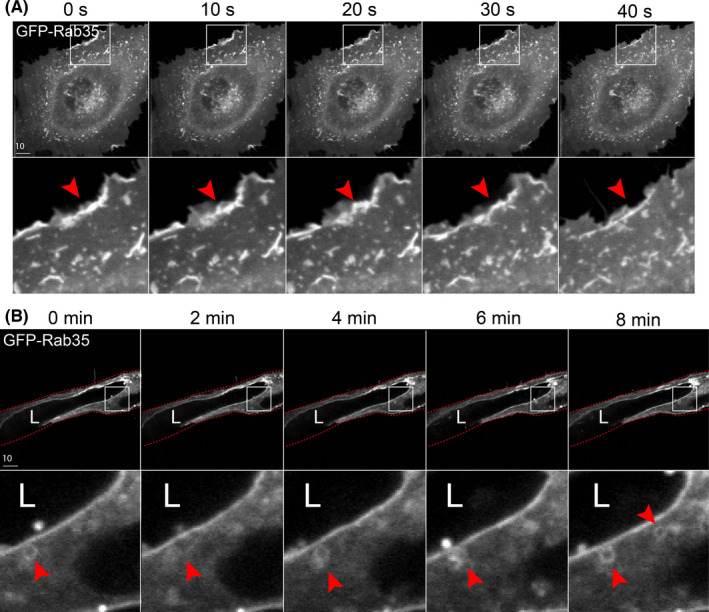
Live imaging of Rab35 trafficking in 2D culture and 3D sprouts. (A) Live imaging of cell expressing GFP‐Rab35 over time. Red arrowheads denote puncta accumulated at the leading edge of the cell. (B) Live imaging of fibrin bead generated sprout expressing GFP‐Rab35 over time. Red arrowheads indicate small endosome movements. White boxes are areas of magnification and red lines indicated sprout boundaries. L denotes lumen [Colour figure can be viewed at wileyonlinelibrary.com]