Figure 9.
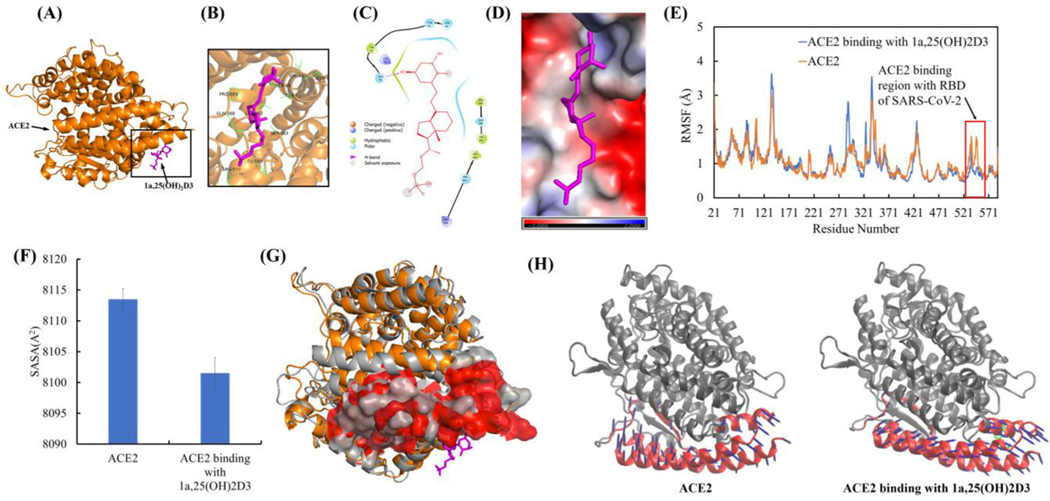
1a,25(OH)2D3 (1,25(OH)2D3) interactions with ACE2 resulted in the conformational and dynamical motion changes of ACE2 binding surface for SARS-CoV-2 RBD. (A) The representative ACE2 binding mode with 1,25(OH)2D3 from equilibrated MD simulation (image made with PyMOL (v2.4.0, https://pymol.org/2/)). (B) 3D representation of 1,25(OH)2D3 interaction with binding region of ACE2 (image made with PyMOL (v2.4.0, https://pymol.org/2/)). (C) 2D representation of 1,25(OH)2D3 interaction with binding region of ACE2 (image made with Maestro (v12.4, https://www.schrodinger.com/products/maestro)). (D) Electrostatic potential of ACE2 at its binding region with 1,25(OH)2D3 (in magenta). Red: negative electrostatic potential; Blue: positive electrostatic potential and White: neutral electrostatic potential (image made with PyMOL (v2.4.0, https://pymol.org/2/)). (E) RMSF of ACE2 with and without 1,25(OH)2D3 binding (Δuplicate and data shown in average). (F) Comparison of SASA of ACE2 binding region (residues 21–101 and 323–356) for SARS-CoV-2 RBD with and without dynamic interactions with 1,25(OH)2D3. (G) Overlay of ACE2 with and without dynamic interactions with 1,25(OH)2D3 (Before dynamic interactions with 1,25(OH)2D3: ACE2 shown in gray, the surface of ACE2 binding region for SARS-CoV-2 RBD shown in gray. After dynamic interactions with 1,25(OH)2D3: ACE2 shown in orange, the surface of ACE2 binding region with SARS-CoV-2 RBD shown in red). Residues 106–130 were used for two structures alignment. (H) PCA motions of ACE2 binding region for RBD of SARS-CoV-2 with and without binding 1,25(OH)2D3. ACE2 were shown as new cartoon in gray and its binding site for RBD of SARS-CoV-2 in red. 1,25(OH)2D3 shown as licorice in green. Arrows of principal dynamic motion shown as blue. The images were made with VMD (v1.9.2, http://www.ks.uiuc.edu/Research/vmd/).

