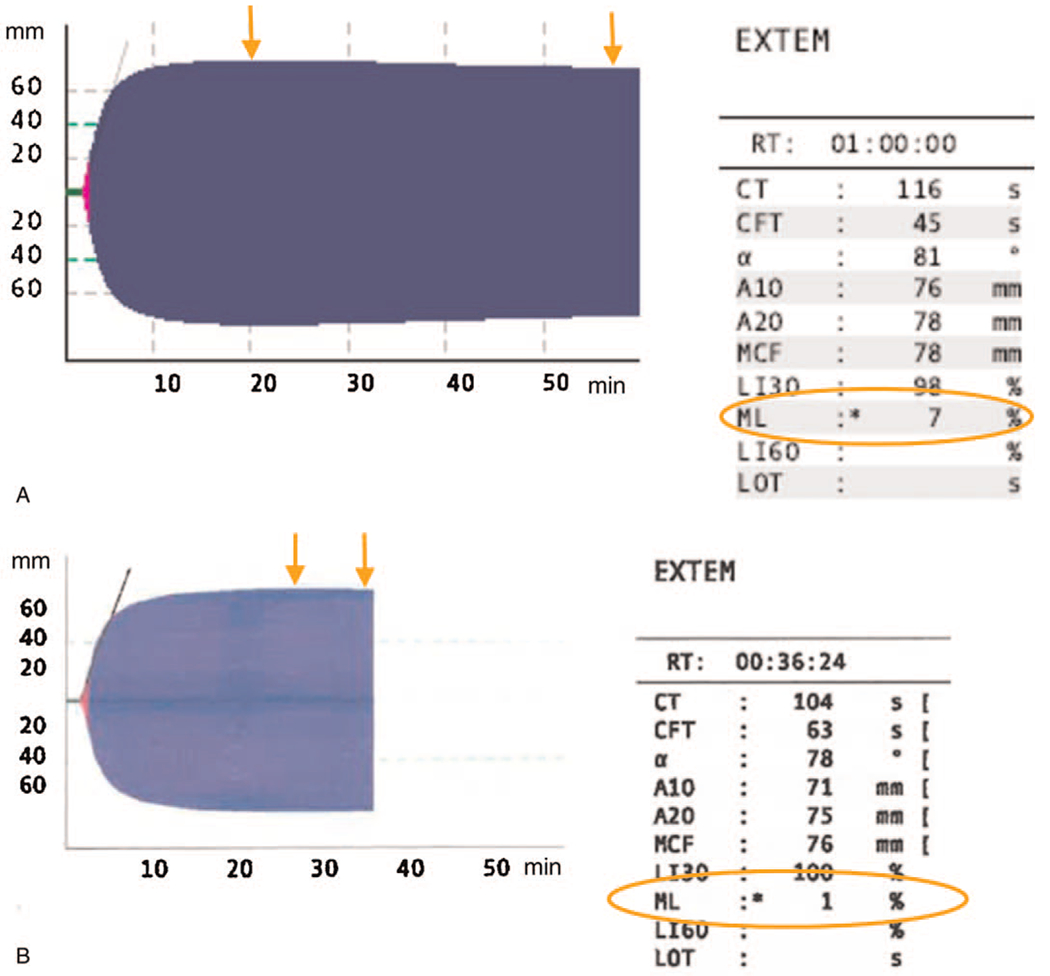
Fig. 2. ROTEM EXTEM tracings in ICU patients with and without fibrinolysis shutdown.

The above are examples of ROTEM EXTEM tracings. ML is calculated by taking the difference between MCF and the lowest amplitude following MCF and then dividing this by MCF. The orange arrows demonstrate the two points used for this ML calculation and the resultant ML (orange circle). A, It demonstrates an EXTEM from a patient with an ML of 7% (no evidence of Fibrinolysis Shutdown). B, It demonstrates an EXTEM from a patient with an ML of 1% (diagnostic of fibrinolysis shutdown) ML indicates maximum lysis; ROTEM, rotational thromboelastometry; MCF, maximum clot firmness.
